Summary
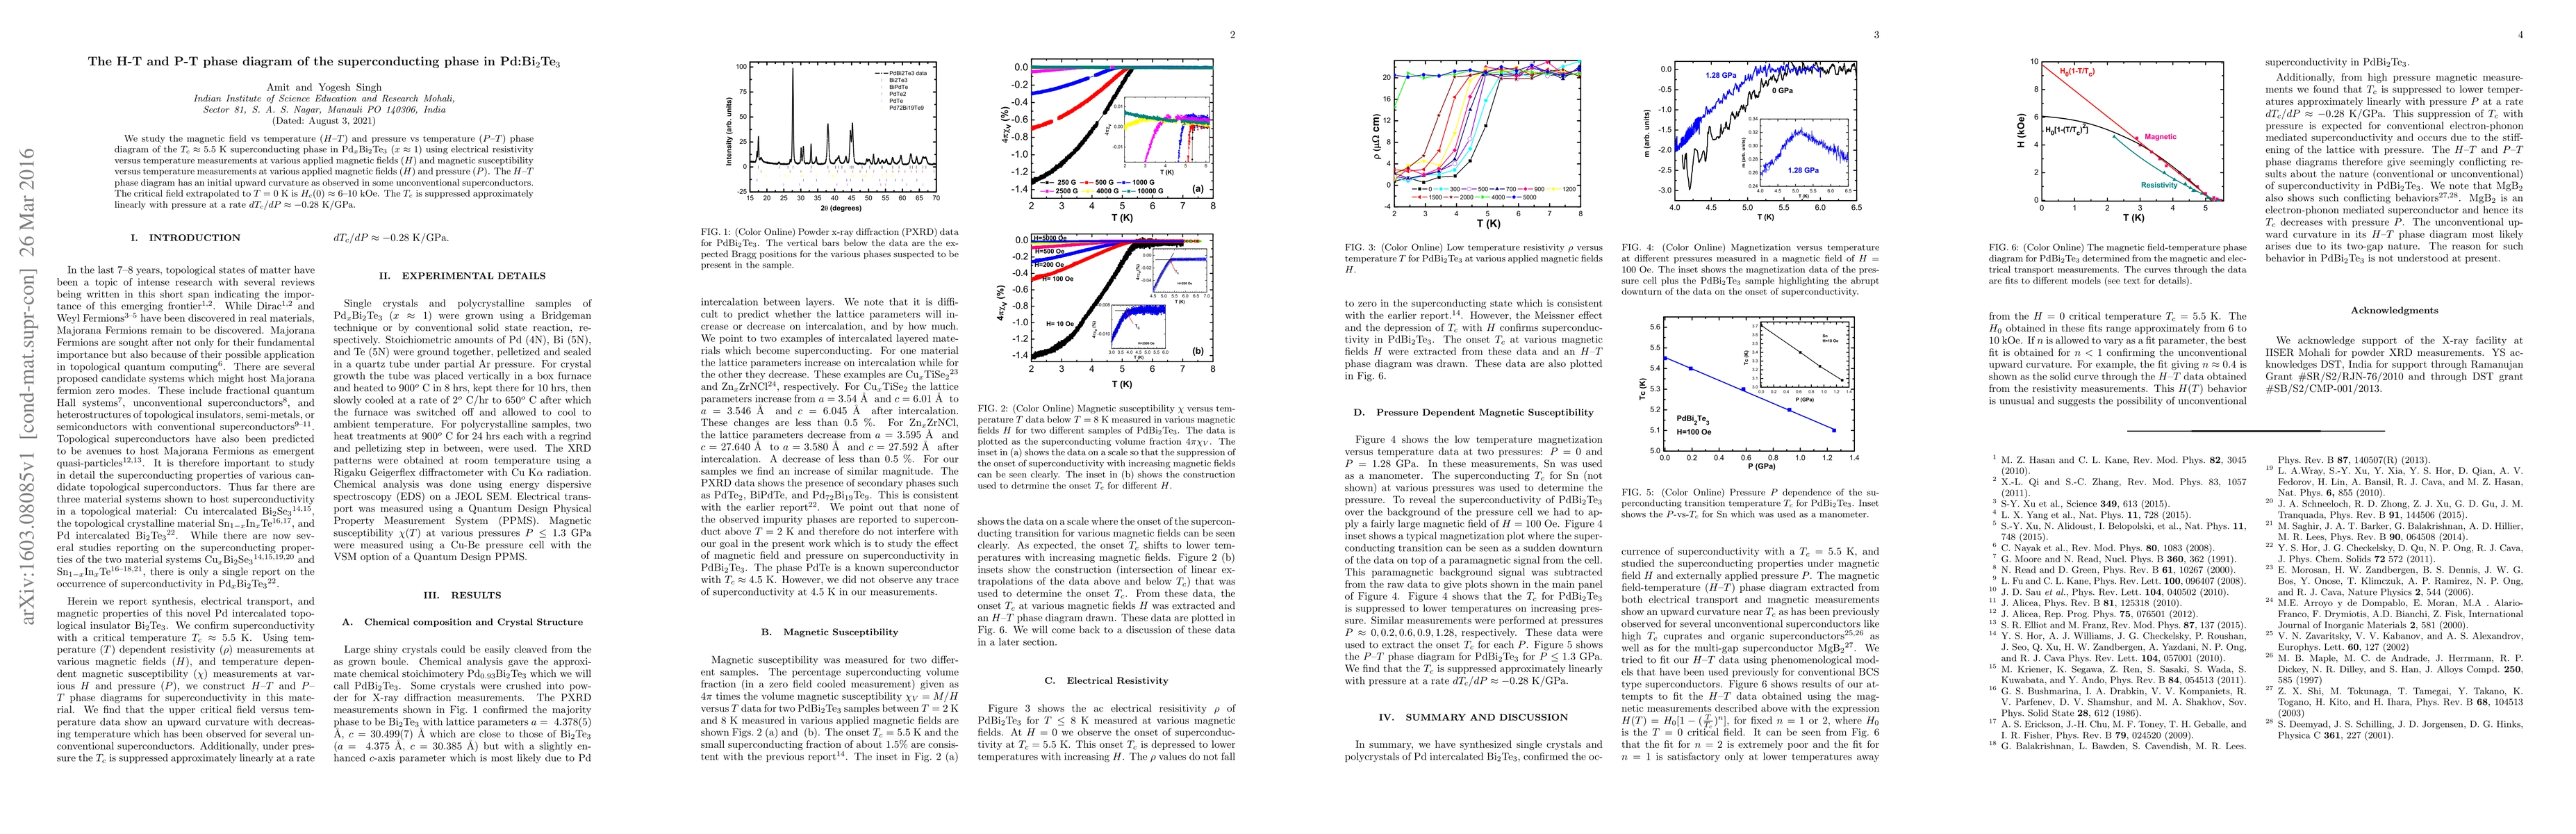
We study the magnetic field vs temperature ($H$--$T$) and pressure vs temperature ($P$--$T$) phase diagram of the $T_c \approx 5.5$~K superconducting phase in Pd$_x$Bi$_2$Te$_3$ ($x \approx 1$) using electrical resistivity versus temperature measurements at various applied magnetic fields ($H$) and magnetic susceptibility versus temperature measurements at various applied magnetic fields ($H$) and pressure ($P$). The $H$--$T$ phase diagram has an initial upward curvature as observed in some unconventional superconductors. The critical field extrapolated to $T = 0$~K is $H_c (0) \approx 6$--$10$~kOe. The $T_c$ is suppressed approximately linearly with pressure at a rate $dT_c/dP \approx -0.28$~K/GPa.
AI Key Findings
Get AI-generated insights about this paper's methodology, results, and significance.
Paper Details
PDF Preview
Key Terms
Citation Network
Current paper (gray), citations (green), references (blue)
Display is limited for performance on very large graphs.
| Title | Authors | Year | Actions |
|---|
Comments (0)