01
MethodologyHow they did it
The research employed a combination of spectroscopic observations and photometric data from the Sloan Digital Sky Survey IV.
The HectoMAP Redshift Survey presents its first data release, comprising 17,313 redshifts for 8.7 square degrees, with a median redshift of over 0.3 and a mean density of 2000 galaxies per square degree. The survey highlights two applications: refined cluster membership and a test of photometric redshifts, revealing systematic issues.
The HectoMAP Redshift Survey presents its first data release, comprising 17,313 redshifts for 8.7 square degrees, with a median redshift of over 0.3 and a mean density of 2000 galaxies per square degree. The survey highlights two applications: refined cluster membership and a test of photometric redshifts, revealing systematic issues.
The research employed a combination of spectroscopic observations and photometric data from the Sloan Digital Sky Survey IV. More in Methodology →
The detection of 524 stars in the Hectospec region with radial velocities below 730 km/s — The identification of galaxies in the SDSS catalog with corresponding redshifts More in Key Results →
This study contributes to our understanding of galaxy evolution and the distribution of stars in the universe. More in Significance →
The limited sample size and potential biases in the spectroscopic observations — The reliance on a single dataset and potential limitations in terms of spatial coverage More in Limitations →
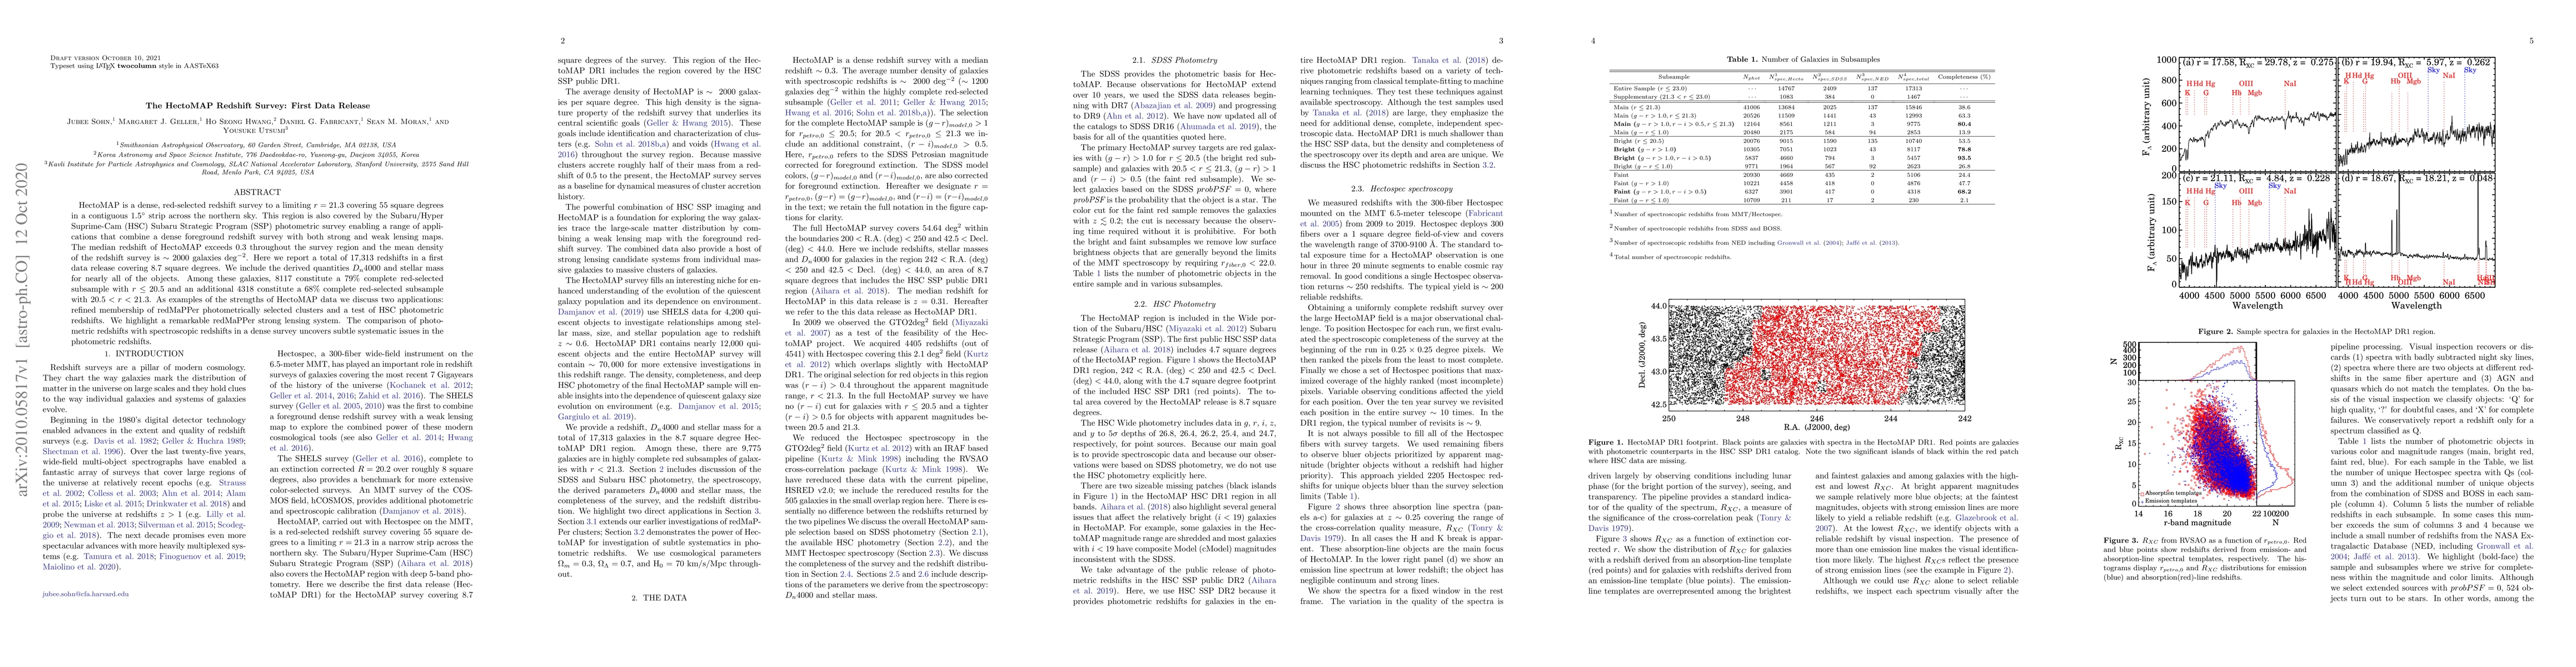
HectoMAP is a dense, red-selected redshift survey to a limiting $r = 21.3$ covering 55 square degrees in a contiguous 1.5$^\circ$ strip across the northern sky. This region is also covered by the Subaru/Hyper Suprime-Cam (HSC) Subaru Strategic Program (SSP) photometric survey enabling a range of applications that combine a dense foreground redshift survey with both strong and weak lensing maps. The median redshift of HectoMAP exceeds 0.3 throughout the survey region and the mean density of the redshift survey is $\sim 2000$ galaxies deg$^{-2}$. Here we report a total of 17,313 redshifts in a first data release covering 8.7 square degrees. We include the derived quantities D$_{n}4000$ and stellar mass for nearly all of the objects. Among these galaxies, 8117 constitute a 79\% complete red-selected subsample with $r \leq 20.5$ and an additional 4318 constitute a 68\% complete red-selected subsample with $20.5 < r < 21.3$. As examples of the strengths of HectoMAP data we discuss two applications: refined membership of redMaPPer photometrically selected clusters and a test of HSC photometric redshifts. We highlight a remarkable redMaPPer strong lensing system. The comparison of photometric redshifts with spectroscopic redshifts in a dense survey uncovers subtle systematic issues in the photometric redshifts.
Seven facets of this paper, analysed and brought into focus by AI.
This study contributes to our understanding of galaxy evolution and the distribution of stars in the universe.
The research employed a combination of spectroscopic observations and photometric data from the Sloan Digital Sky Survey IV.
This study contributes to our understanding of galaxy evolution and the distribution of stars in the universe.
The development of new algorithms for spectroscopic data reduction and analysis
The application of machine learning techniques to galaxy classification and property estimation
Current paper (gray), citations (green), references (blue)
Display is limited for performance on very large graphs.
Discussion 0