Publication
Metrics
AI Quick Summary
This paper investigates the apparent absence of jet breaks in X-ray afterglow light curves of Gamma-Ray Bursts (GRBs) observed in the Swift era, suggesting that these breaks may be "hidden" and thus misinterpreted as single power-laws. It proposes methods to identify such breaks through multi-wavelength analysis and Monte Carlo simulations.
Paper Preview
Abstract
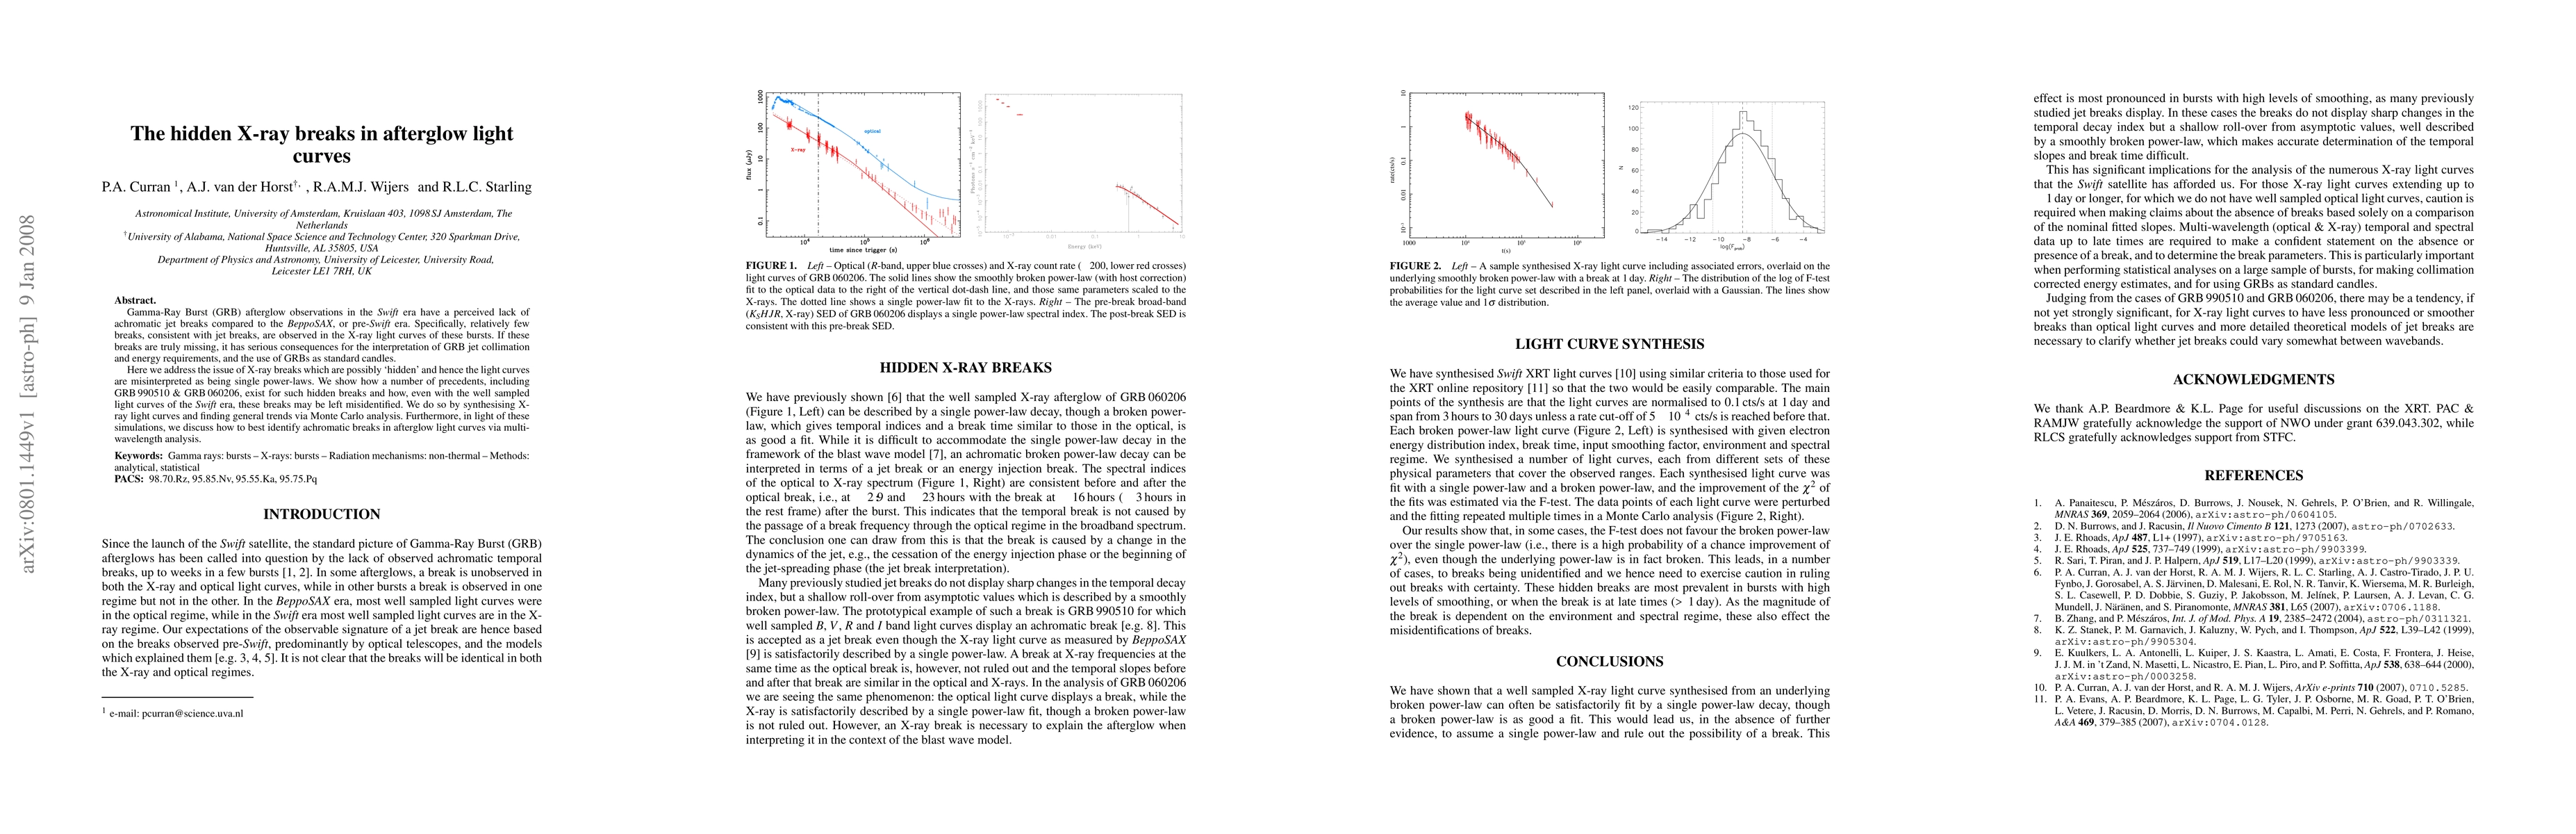
Gamma-Ray Burst (GRB) afterglow observations in the Swift era have a perceived lack of achromatic jet breaks compared to the BeppoSAX, or pre-Swift era. Specifically, relatively few breaks, consistent with jet breaks, are observed in the X-ray light curves of these bursts. If these breaks are truly missing, it has serious consequences for the interpretation of GRB jet collimation and energy requirements, and the use of GRBs as standard candles. Here we address the issue of X-ray breaks which are possibly 'hidden' and hence the light curves are misinterpreted as being single power-laws. We show how a number of precedents, including GRB 990510 & GRB 060206, exist for such hidden breaks and how, even with the well sampled light curves of the Swift era, these breaks may be left misidentified. We do so by synthesising X-ray light curves and finding general trends via Monte Carlo analysis. Furthermore, in light of these simulations, we discuss how to best identify achromatic breaks in afterglow light curves via multi-wavelength analysis.
AI Key Findings
Get AI-generated insights about this paper's methodology, results, significance, and more — seven facets brought into focus.
Impact
Paper Details
PDF Preview
Key Terms
Citation Network
Current paper (gray), citations (green), references (blue)
Display is limited for performance on very large graphs.
Discussion 0