The impact of Gene Ontology evolution on GO-Term Information Content
Publication
Metrics
AI Quick Summary
This paper investigates the impact of Gene Ontology (GO) evolution on the information content (IC) of GO terms, revealing significant differences in IC calculations across various GO versions and formulations. The study highlights the need for careful consideration of GO changes when using semantic similarities, as they can introduce notable biases.
Paper Preview
Abstract
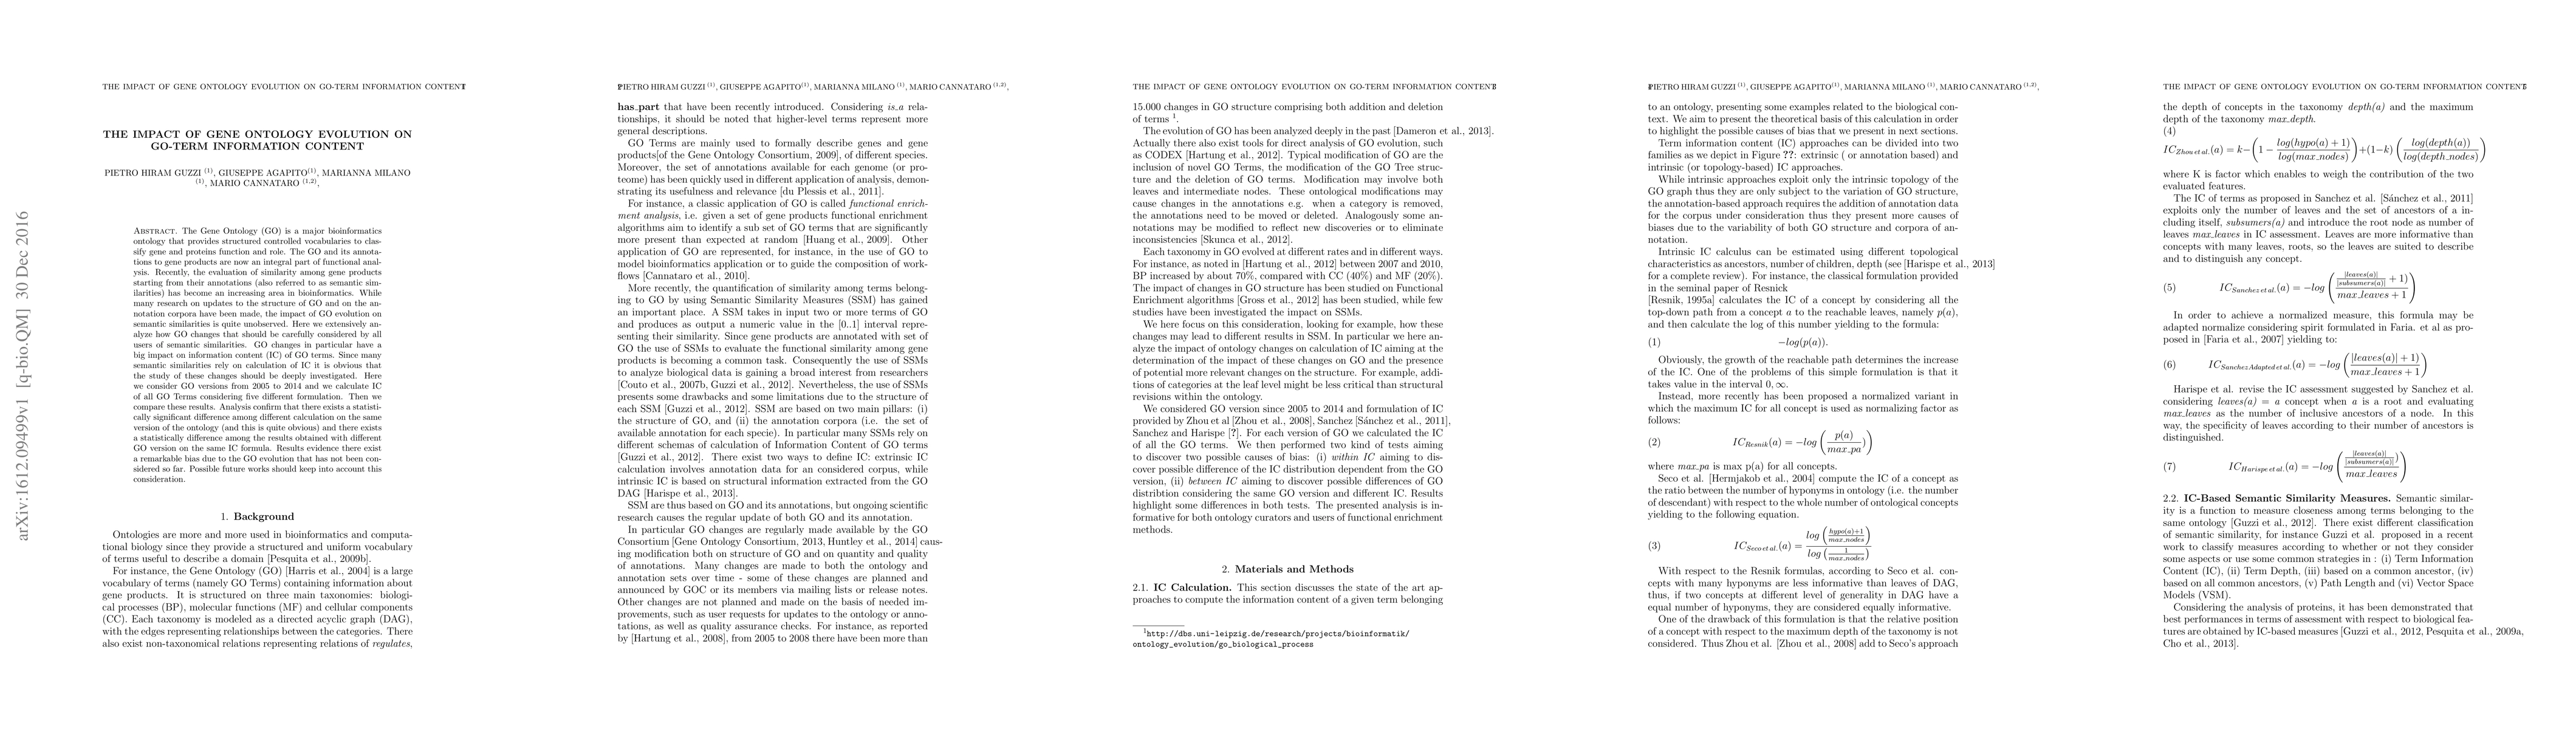
The Gene Ontology (GO) is a major bioinformatics ontology that provides structured controlled vocabularies to classify gene and proteins function and role. The GO and its annotations to gene products are now an integral part of functional analysis. Recently, the evaluation of similarity among gene products starting from their annotations (also referred to as semantic similarities) has become an increasing area in bioinformatics. While many research on updates to the structure of GO and on the annotation corpora have been made, the impact of GO evolution on semantic similarities is quite unobserved. Here we extensively analyze how GO changes that should be carefully considered by all users of semantic similarities. GO changes in particular have a big impact on information content (IC) of GO terms. Since many semantic similarities rely on calculation of IC it is obvious that the study of these changes should be deeply investigated. Here we consider GO versions from 2005 to 2014 and we calculate IC of all GO Terms considering five different formulation. Then we compare these results. Analysis confirm that there exists a statistically significant difference among different calculation on the same version of the ontology (and this is quite obvious) and there exists a statistically difference among the results obtained with different GO version on the same IC formula. Results evidence there exist a remarkable bias due to the GO evolution that has not been considered so far. Possible future works should keep into account this consideration.
AI Key Findings
Get AI-generated insights about this paper's methodology, results, significance, and more — seven facets brought into focus.
Impact
Paper Details
PDF Preview
Key Terms
Citation Network
Current paper (gray), citations (green), references (blue)
Display is limited for performance on very large graphs.
Discussion 0