Publication
Metrics
AI Quick Summary
This study compares solar granulation contrast observed by Hinode's Spectro-Polarimeter (SP) with 3D radiative MHD simulations. After accounting for optical system effects and slight defocus, the simulated contrast aligns closely with the observed value, suggesting Hinode SP data supports MHD simulation predictions for granulation contrast.
Paper Preview
Abstract
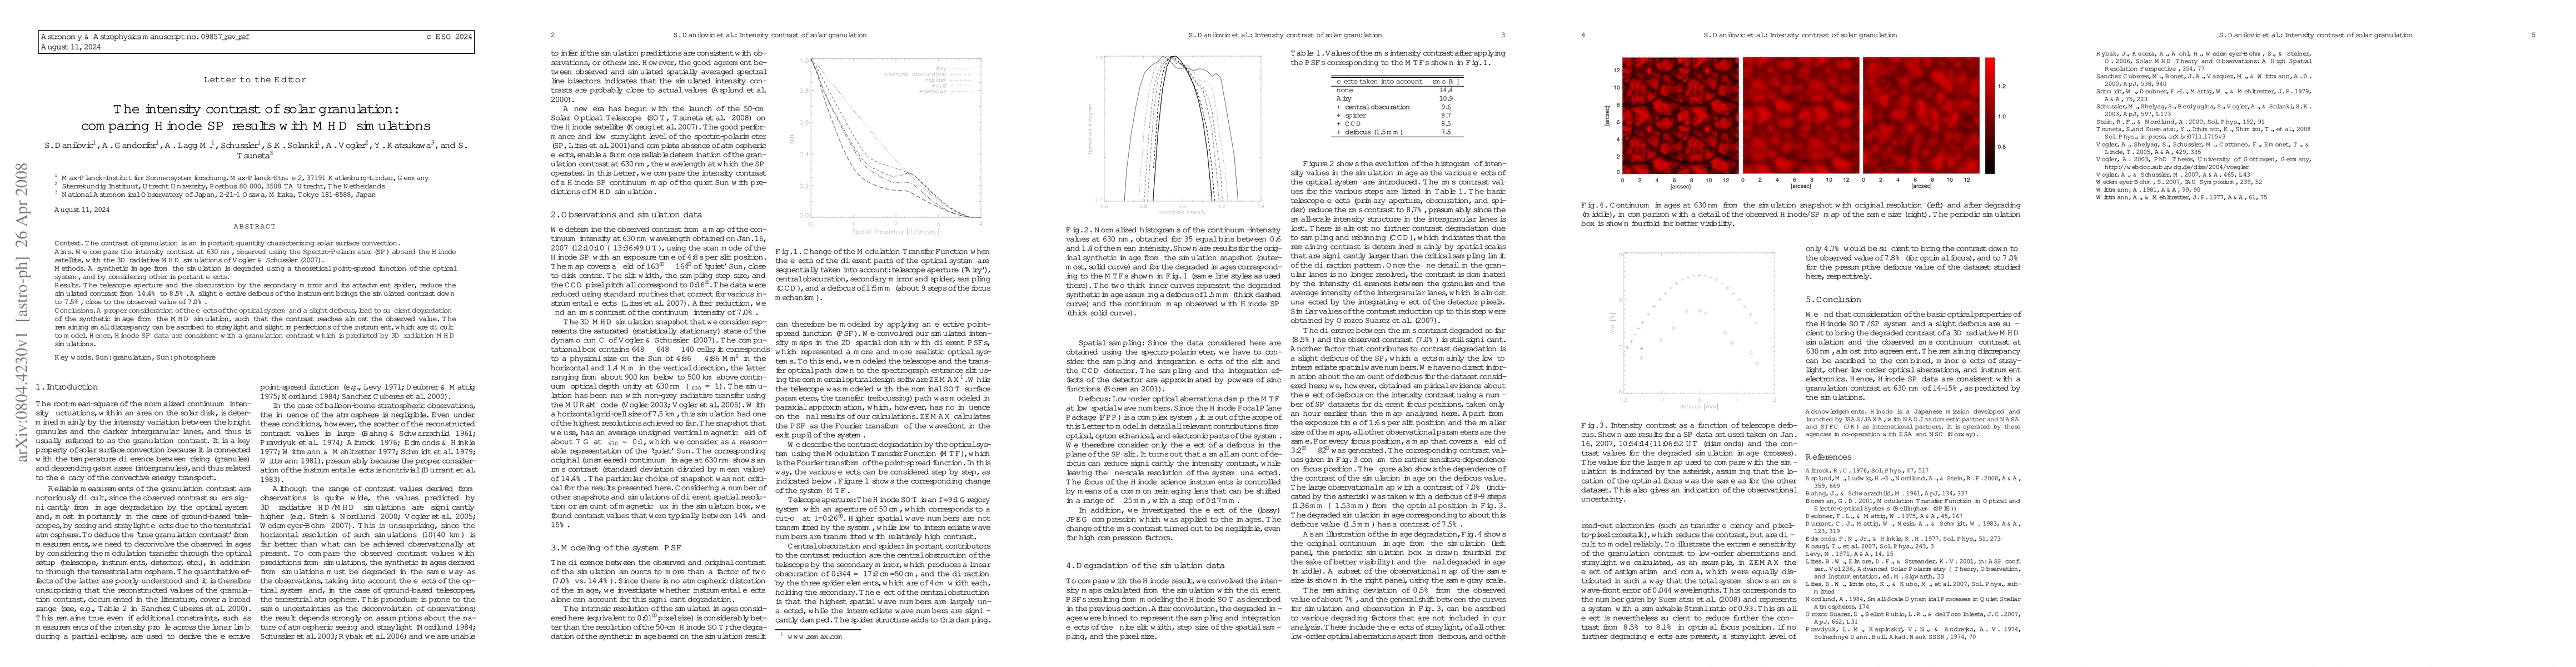
The contrast of granulation is an important quantity characterizing solar surface convection. We compare the intensity contrast at 630 nm, observed using the Spectro-Polarimeter (SP) aboard the Hinode satellite, with the 3D radiative MHD simulations of V{\"o}gler & Sch{\"u}ssler (2007). A synthetic image from the simulation is degraded using a theoretical point-spread function of the optical system, and by considering other important effects. The telescope aperture and the obscuration by the secondary mirror and its attachment spider, reduce the simulated contrast from 14.4 % to 8.5 %. A slight effective defocus of the instrument brings the simulated contrast down to 7.5 %, close to the observed value of 7.0 %. A proper consideration of the effects of the optical system and a slight defocus, lead to sufficient degradation of the synthetic image from the MHD simulation, such that the contrast reaches almost the observed value. The remaining small discrepancy can be ascribed to straylight and slight imperfections of the instrument, which are difficult to model. Hence, Hinode SP data are consistent with a granulation contrast which is predicted by 3D radiation MHD simulations.
AI Key Findings
Get AI-generated insights about this paper's methodology, results, significance, and more — seven facets brought into focus.
Impact
Paper Details
PDF Preview
Key Terms
Citation Network
Current paper (gray), citations (green), references (blue)
Display is limited for performance on very large graphs.
Discussion 0