Summary
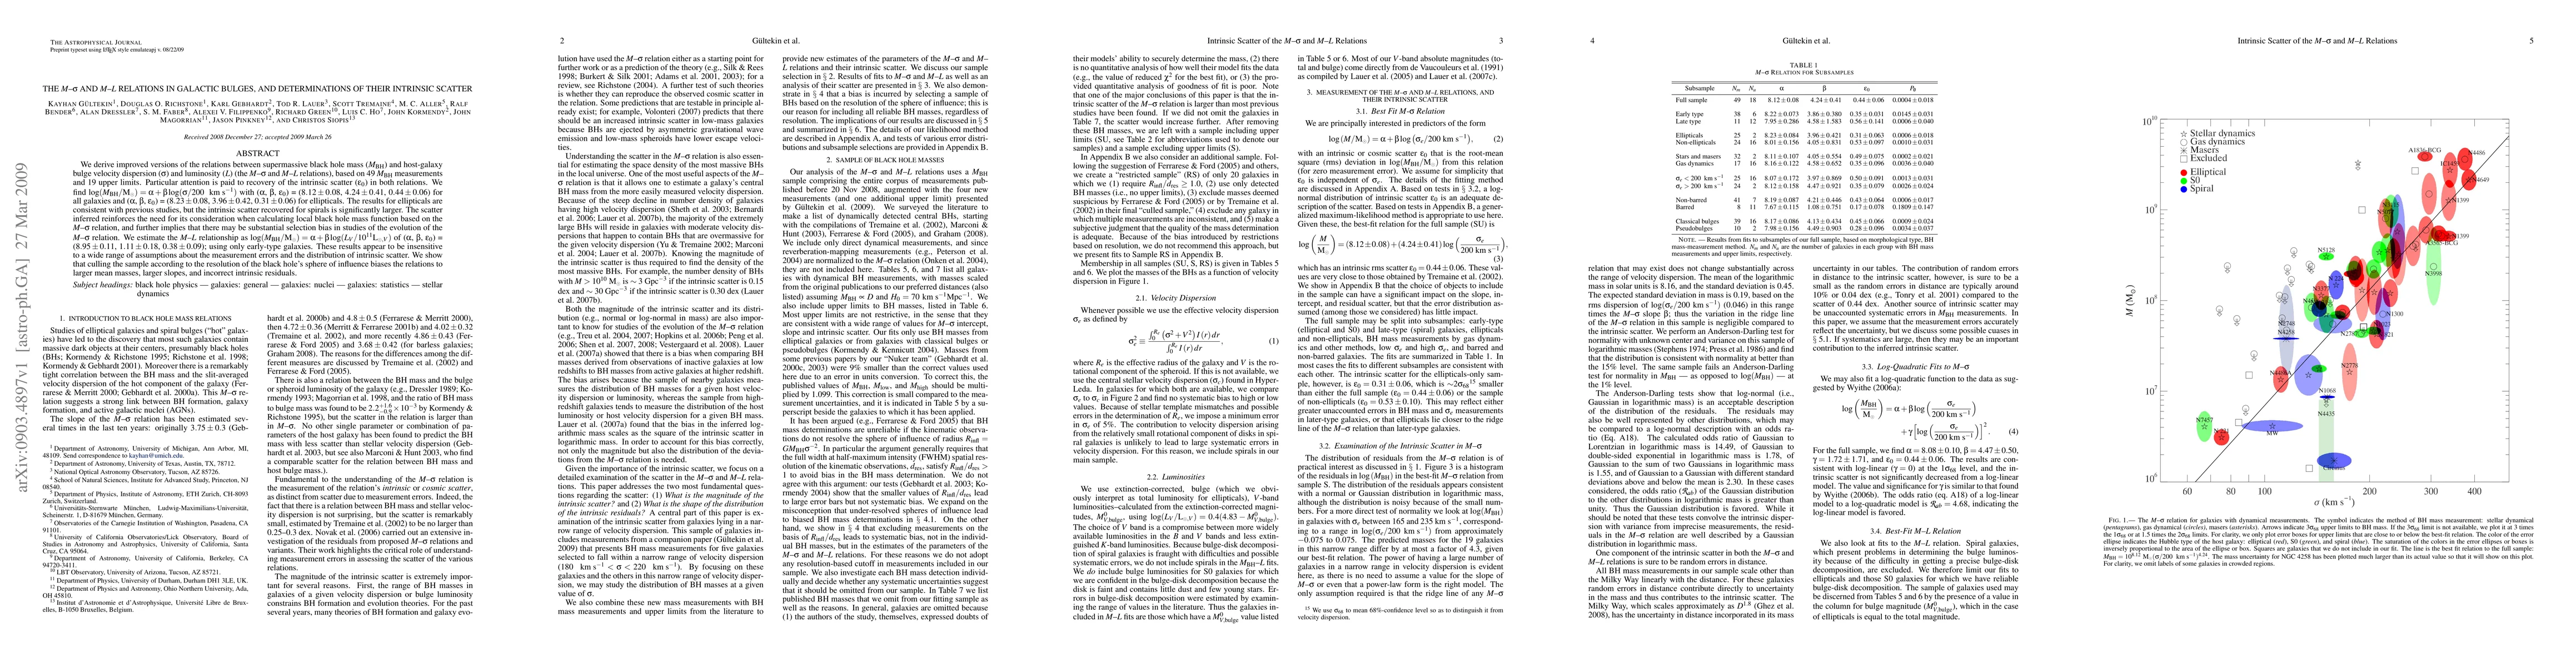
We derive improved versions of the relations between supermassive black hole mass (M_BH) and host-galaxy bulge velocity dispersion (sigma) and luminosity (L) (the M-sigma and M-L relations), based on 49 M_BH measurements and 19 upper limits. Particular attention is paid to recovery of the intrinsic scatter (epsilon_0) in both relations. We find log(M_BH / M_sun) = alpha + beta * log(sigma / 200 km/s) with (alpha, beta, epsilon_0) = (8.12 +/- 0.08, 4.24 +/- 0.41, 0.44 +/- 0.06) for all galaxies and (alpha, beta, epsilon_0) = (8.23 +/- 0.08, 3.96 +/- 0.42, 0.31 +/- 0.06) for ellipticals. The results for ellipticals are consistent with previous studies, but the intrinsic scatter recovered for spirals is significantly larger. The scatter inferred reinforces the need for its consideration when calculating local black hole mass function based on the M-sigma relation, and further implies that there may be substantial selection bias in studies of the evolution of the M-sigma relation. We estimate the M-L relationship as log(M_BH / M_sun) = alpha + beta * log(L_V / 10^11 L_sun,V) of (alpha, beta, epsilon_0) = (8.95 +/- 0.11, 1.11 +/- 0.18, 0.38 +/- 0.09); using only early-type galaxies. These results appear to be insensitive to a wide range of assumptions about the measurement errors and the distribution of intrinsic scatter. We show that culling the sample according to the resolution of the black hole's sphere of influence biases the relations to larger mean masses, larger slopes, and incorrect intrinsic residuals.
AI Key Findings
Get AI-generated insights about this paper's methodology, results, and significance.
Comments (0)