The Mass Profile of the Galaxy to 80 kpc
Publication
Metrics
AI Quick Summary
This study uses the Hypervelocity Star survey, containing the largest sample of radial velocity measurements of halo stars out to 80 kpc, to derive the mass profile of the Milky Way Galaxy. By applying spherical Jeans modeling to data beyond 25 kpc, where halo star density follows a power-law, the researchers find that the radial velocity dispersion and circular velocity profiles decline very little with radius. This suggests a massive, extended dark matter halo, with a mass enclosed within 80 kpc estimated at 6.9(+3.0-1.2) 10^11 Msun. The primary uncertainty in the mass determination stems from the density slope and anisotropy of the tracer population.
Paper Preview
Abstract
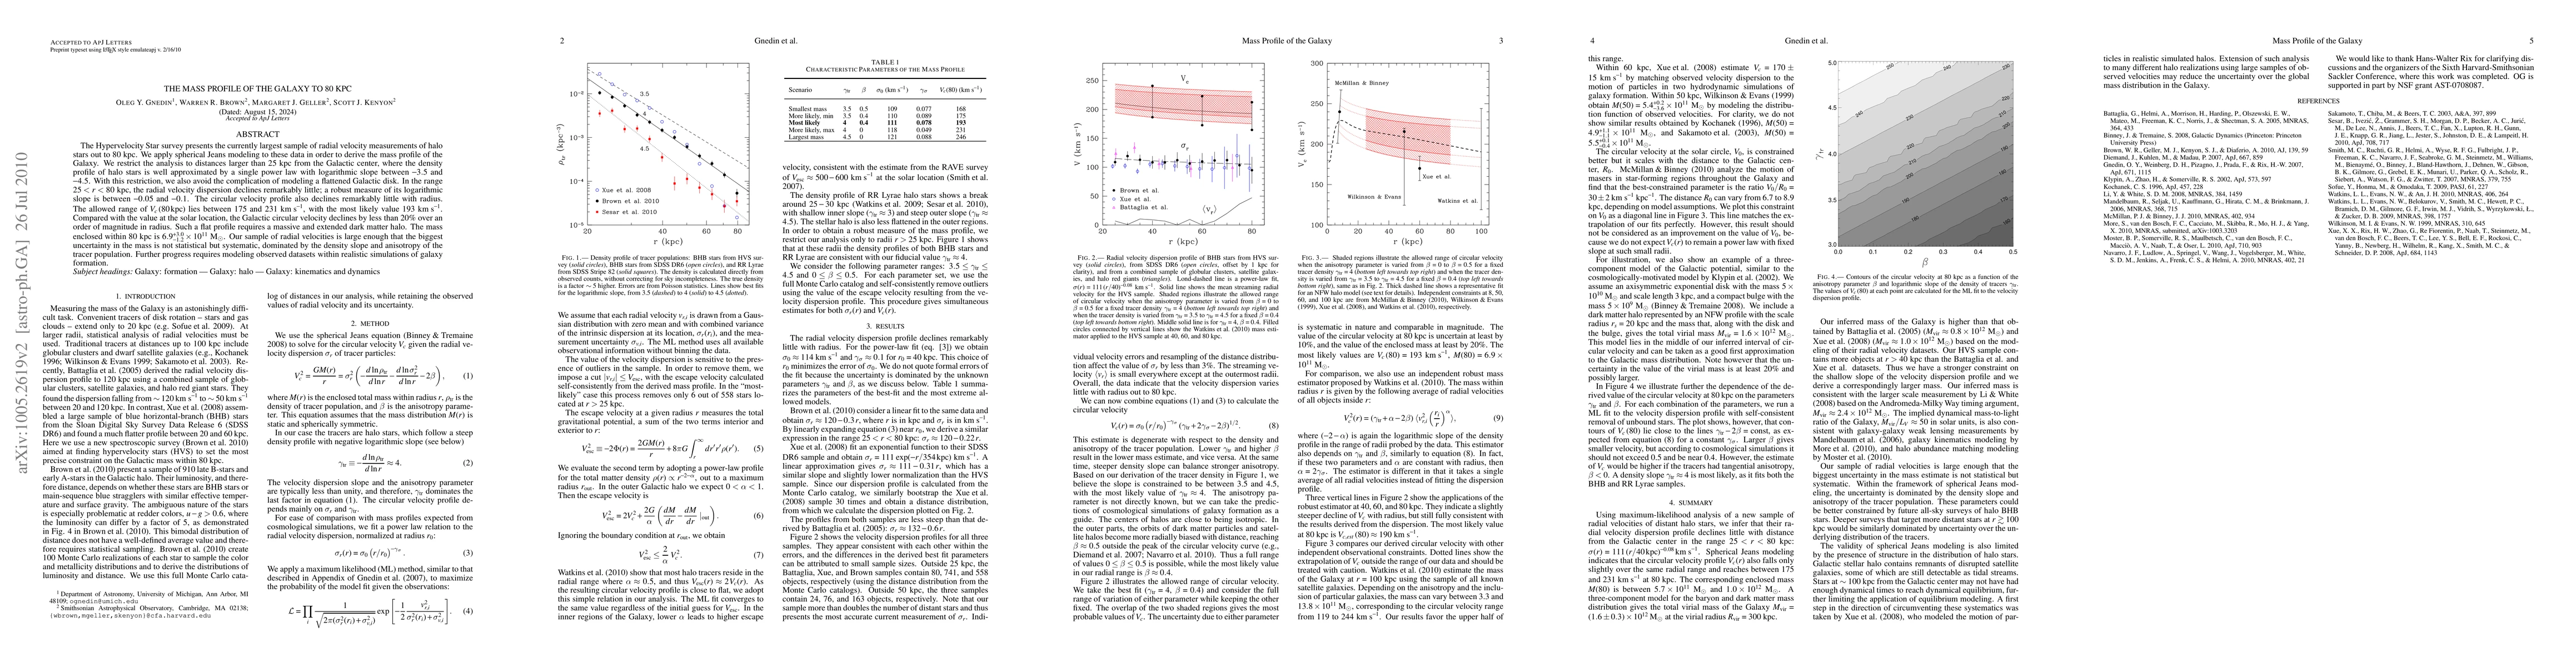
The Hypervelocity Star survey presents the currently largest sample of radial velocity measurements of halo stars out to 80 kpc. We apply spherical Jeans modeling to these data in order to derive the mass profile of the Galaxy. We restrict the analysis to distances larger than 25 kpc from the Galactic center, where the density profile of halo stars is well approximated by a single power law with logarithmic slope between -3.5 and -4.5. With this restriction, we also avoid the complication of modeling a flattened Galactic disk. In the range 25 < r < 80 kpc, the radial velocity dispersion declines remarkably little; a robust measure of its logarithmic slope is between -0.05 and -0.1. The circular velocity profile also declines remarkably little with radius. The allowed range of V_c(80 kpc) lies between 175 and 231 km/s, with the most likely value 193 km/s. Compared with the value at the solar location, the Galactic circular velocity declines by less than 20% over an order of magnitude in radius. Such a flat profile requires a massive and extended dark matter halo. The mass enclosed within 80 kpc is 6.9(+3.0-1.2) 10^11 Msun. Our sample of radial velocities is large enough that the biggest uncertainty in the mass is not statistical but systematic, dominated by the density slope and anisotropy of the tracer population. Further progress requires modeling observed datasets within realistic simulations of galaxy formation.
AI Key Findings
Get AI-generated insights about this paper's methodology, results, significance, and more — seven facets brought into focus.
Impact
Paper Details
PDF Preview
Key Terms
Citation Network
Current paper (gray), citations (green), references (blue)
Display is limited for performance on very large graphs.
Discussion 0