Summary
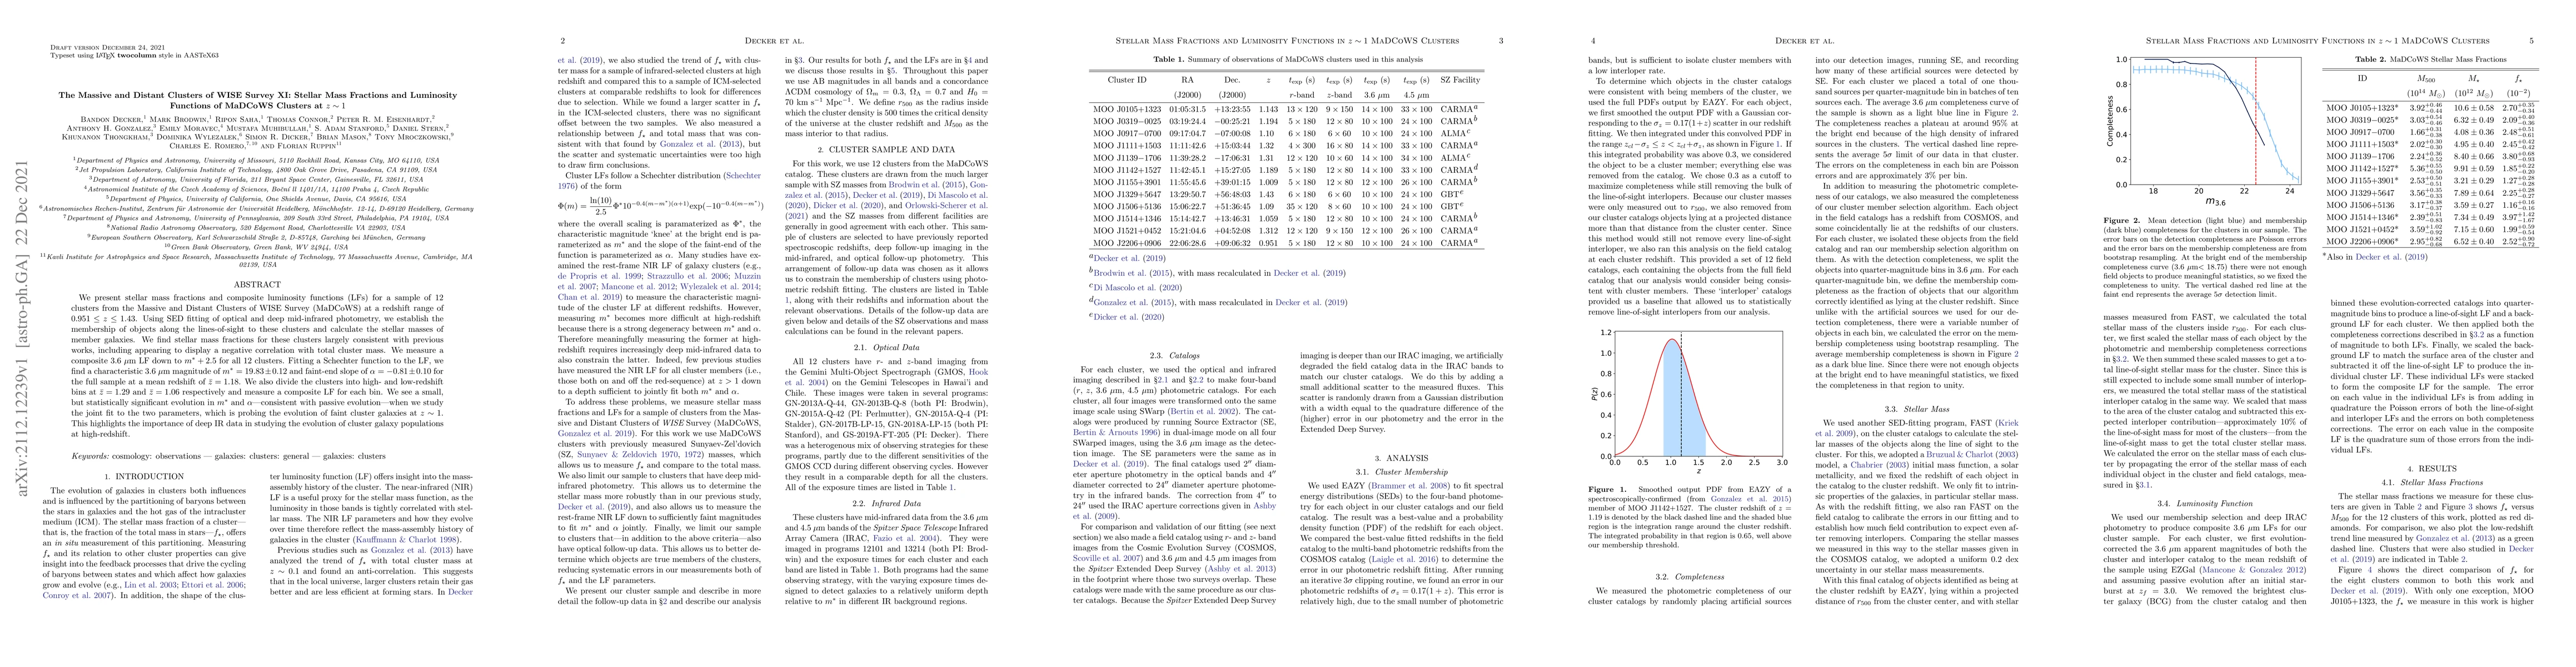
We present stellar mass fractions and composite luminosity functions (LFs) for a sample of \Ncl\ clusters from the Massive and Distant Clusters of WISE Survey (MaDCoWS) at a redshift range of $0.951 \leq z \leq 1.43$. Using SED fitting of optical and deep mid-infrared photometry, we establish the membership of objects along the lines-of-sight to these clusters and calculate the stellar masses of member galaxies. We find stellar mass fractions for these clusters largely consistent with previous works, including appearing to display a negative correlation with total cluster mass. We measure a composite $3.6~\mathrm{\mu m}$ LF down to $m^*+2.5$ for all 12 clusters. Fitting a Schechter function to the LF, we find a characteristic $3.6~\mathrm{\mu m}$ magnitude of $m^*=19.83\pm0.12$ and faint-end slope of $\alpha=-0.81\pm0.10$ for the full sample at a mean redshift of $\bar{z} = 1.18$. We also divide the clusters into high- and low-redshift bins at $\bar{z}=1.29$ and $\bar{z}=1.06$ respectively and measure a composite LF for each bin. We see a small, but statistically significant evolution in $m^*$ and $\alpha$ -- consistent with passive evolution -- when we study the joint fit to the two parameters, which is probing the evolution of faint cluster galaxies at $z\sim1$. This highlights the importance of deep IR data in studying the evolution of cluster galaxy populations at high-redshift.
AI Key Findings
Get AI-generated insights about this paper's methodology, results, and significance.
Paper Details
PDF Preview
Key Terms
Citation Network
Current paper (gray), citations (green), references (blue)
Display is limited for performance on very large graphs.
Similar Papers
Found 4 papers| Title | Authors | Year | Actions |
|---|
Comments (0)