Publication
Metrics
AI Quick Summary
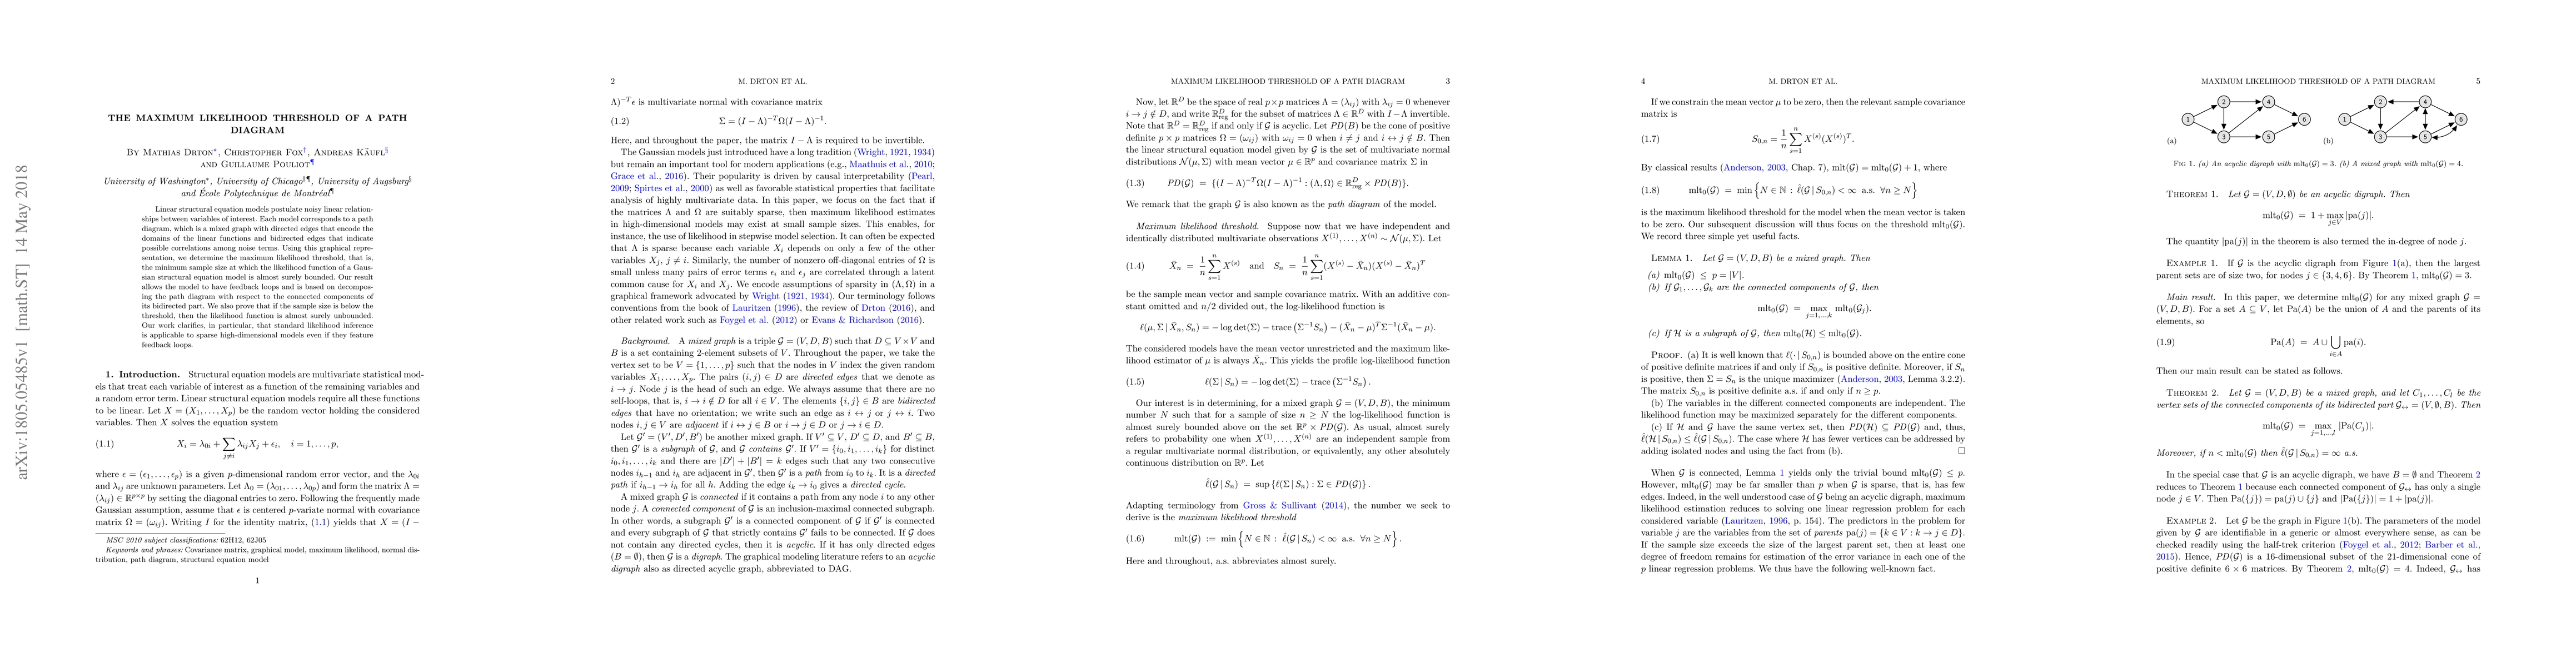
This paper determines the maximum likelihood threshold for Gaussian structural equation models represented by path diagrams, showing that the likelihood function is almost surely bounded when the sample size exceeds this threshold. It also proves that below this threshold, the likelihood function is almost surely unbounded, clarifying the applicability of standard inference methods to sparse high-dimensional models with feedback loops.
Paper Preview
Abstract
Linear structural equation models postulate noisy linear relationships between variables of interest. Each model corresponds to a path diagram, which is a mixed graph with directed edges that encode the domains of the linear functions and bidirected edges that indicate possible correlations among noise terms. Using this graphical representation, we determine the maximum likelihood threshold, that is, the minimum sample size at which the likelihood function of a Gaussian structural equation model is almost surely bounded. Our result allows the model to have feedback loops and is based on decomposing the path diagram with respect to the connected components of its bidirected part. We also prove that if the sample size is below the threshold, then the likelihood function is almost surely unbounded. Our work clarifies, in particular, that standard likelihood inference is applicable to sparse high-dimensional models even if they feature feedback loops.
AI Key Findings
Get AI-generated insights about this paper's methodology, results, significance, and more — seven facets brought into focus.
Impact
Paper Details
PDF Preview
Key Terms
Citation Network
Current paper (gray), citations (green), references (blue)
Display is limited for performance on very large graphs.
Discussion 0