The MICE Grand Challenge Lightcone Simulation III: Galaxy lensing mocks from all-sky lensing maps
Publication
Metrics
AI Quick Summary
This paper presents galaxy lensing mocks derived from all-sky lensing maps created using the MICE Grand Challenge lightcone simulation, which contains 70 billion dark-matter particles. The lensing maps are modeled using the "Onion Universe" approach and validated through galaxy shear auto and cross-correlations, demonstrating accurate modeling of lensing observables down to arcminute scales.
Paper Preview
Abstract
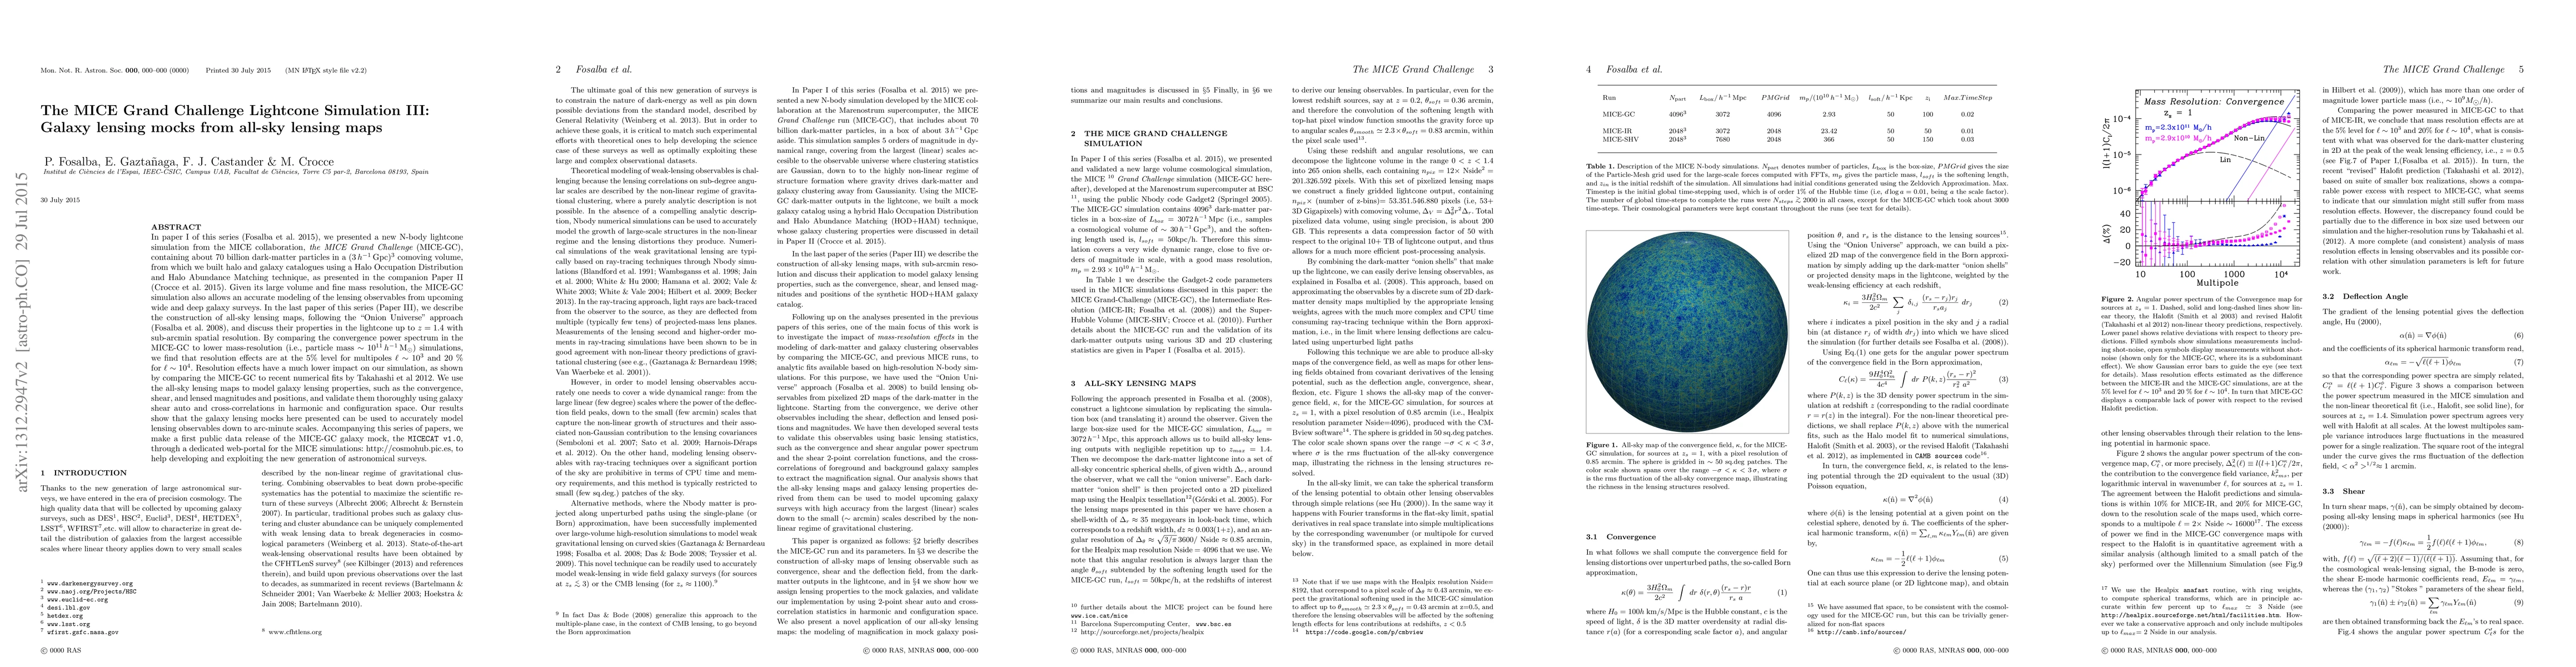
In paper I of this series (Fosalba et al. 2013), we presented a new N-body lightcone simulation from the MICE collaboration, the MICE Grand Challenge (MICE-GC), containing about 70 billion dark-matter particles in a (3 Gpc)^3 comoving volume, from which we built halo and galaxy catalogues using a Halo Occupation Distribution and Halo Abundance Matching technique, as presented in the companion Paper II (Crocce et al. 2013). Given its large volume and fine mass resolution, the MICE-GC simulation also allows an accurate modeling of the lensing observables from upcoming wide and deep galaxy surveys. In the last paper of this series (Paper III), we describe the construction of all-sky lensing maps, following the "Onion Universe" approach (Fosalba et al. 2008), and discuss their properties in the lightcone up to z=1.4 with sub-arcmin spatial resolution. By comparing the convergence power spectrum in the MICE-GC to lower mass-resolution (i.e., particle mass ~ 10^11 Msun) simulations, we find that resolution effects are at the 5 % level for multipoles l ~ 10^3 and 20 % for l ~ 10^4. Resolution effects have a much lower impact on our simulation, as shown by comparing the MICE-GC to recent numerical fits by Takahashi et al 2012. We use the all-sky lensing maps to model galaxy lensing properties, such as the convergence, shear, and lensed magnitudes and positions, and validate them thoroughly using galaxy shear auto and cross-correlations in harmonic and configuration space. Our results show that the galaxy lensing mocks here presented can be used to accurately model lensing observables down to arcminute scales.
AI Key Findings
Get AI-generated insights about this paper's methodology, results, significance, and more — seven facets brought into focus.
Impact
Paper Details
PDF Preview
Key Terms
Citation Network
Current paper (gray), citations (green), references (blue)
Display is limited for performance on very large graphs.
Discussion 0