Authors
Summary
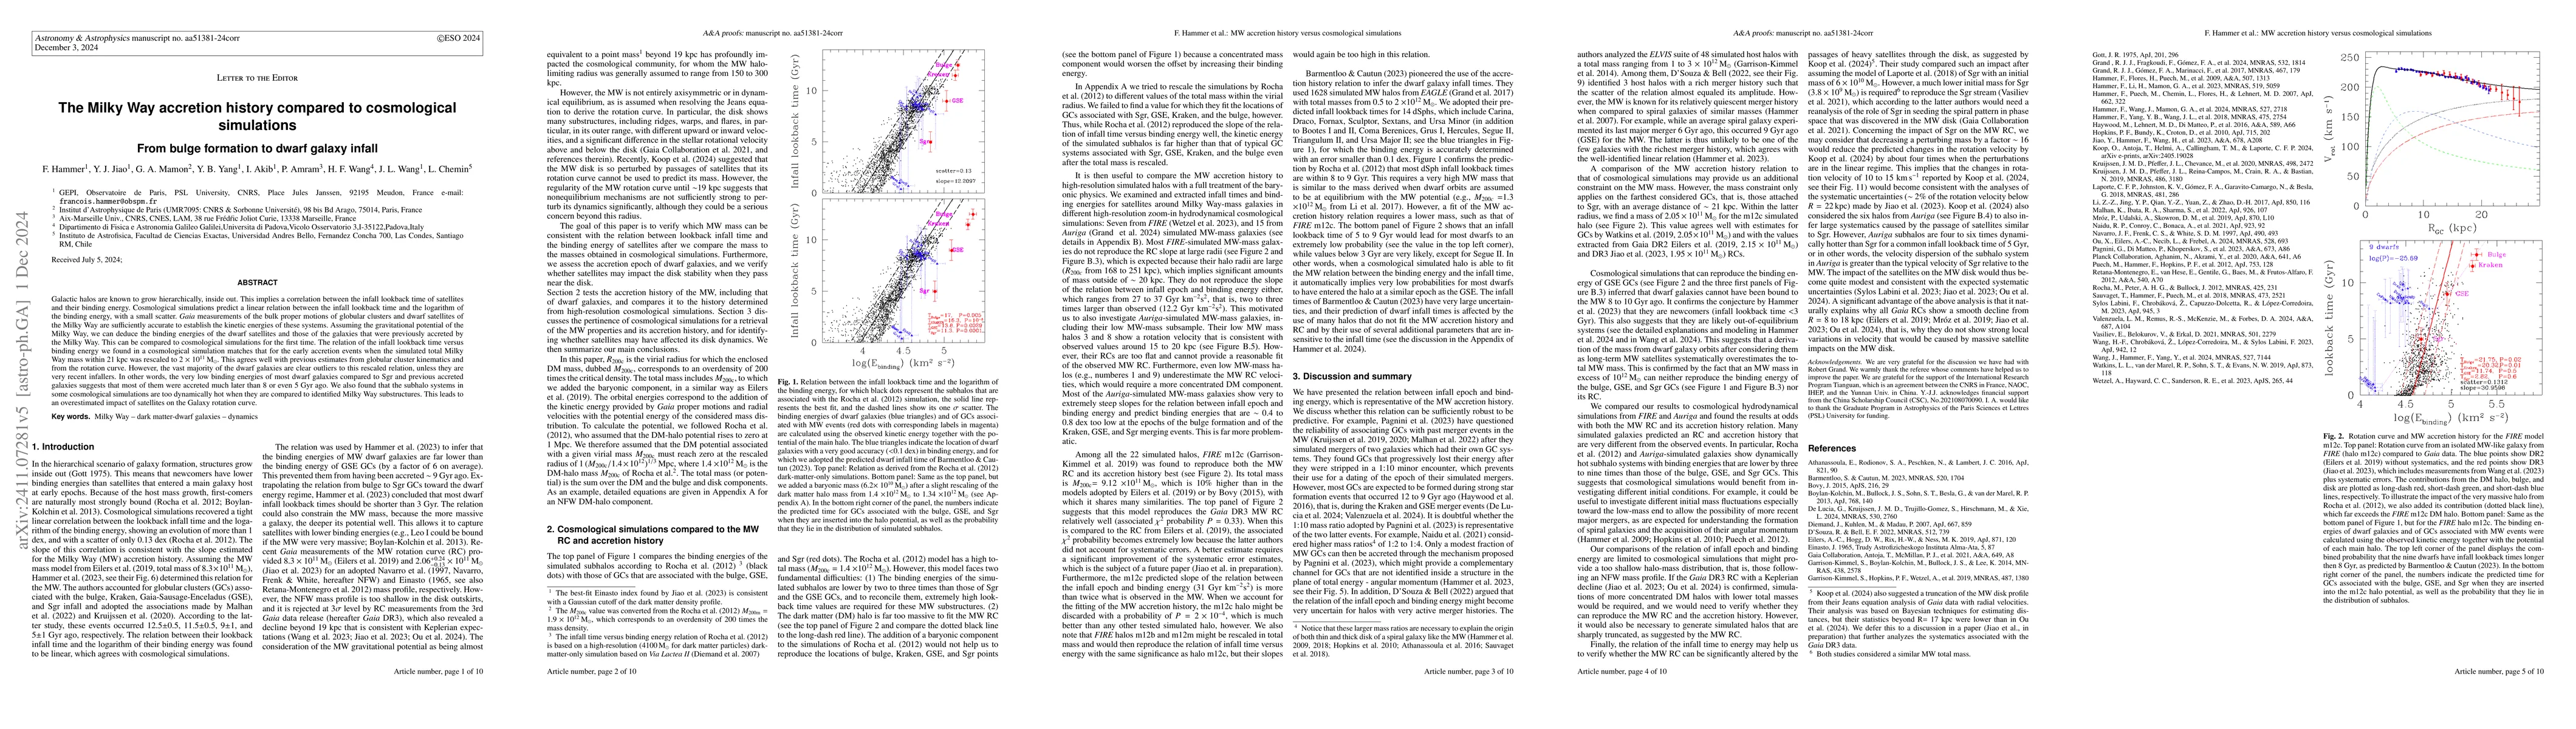
Galactic halos are known to grow hierarchically, inside out. This implies a correlation between the infall lookback time of satellites and their binding energy. Cosmological simulations predict a linear relation between the infall lookback time and the logarithm of the binding energy, with a small scatter. Gaia measurements of the bulk proper motions of globular clusters and dwarf satellites of the Milky Way are sufficiently accurate to establish the kinetic energies of these systems. Assuming the gravitational potential of the Milky Way, we can deduce the binding energies of the dwarf satellites and those of the galaxies that were previously accreted by the Milky Way. This can be compared to cosmological simulations for the first time. The relation of the infall lookback time versus binding energy we found in a cosmological simulation matches that for the early accretion events when the simulated total Milky Way mass within 21 kpc was rescaled to 2 $10^{11}$ solar masses. This agrees well with previous estimates from globular cluster kinematics and from the rotation curve. However, the vast majority of the dwarf galaxies are clear outliers to this rescaled relation, unless they are very recent infallers. In other words, the very low binding energies of most dwarf galaxies compared to Sgr and previous accreted galaxies suggests that most of them were accreted much later than 8 or even 5 Gyr ago. We also found that the subhalo systems in some cosmological simulations are too dynamically hot when they are compared to identified Milky Way substructures. This leads to an overestimated impact of satellites on the Galaxy rotation curve.
AI Key Findings
Get AI-generated insights about this paper's methodology, results, and significance.
Paper Details
PDF Preview
Citation Network
Current paper (gray), citations (green), references (blue)
Display is limited for performance on very large graphs.
Similar Papers
Found 4 papersThe Accretion History of the Milky Way: III. Hydrodynamical Simulations of Galactic Dwarf Galaxies at First Infall
Haifeng Wang, Gary A. Mamon, Jianling Wang et al.
Gaia EDR3 proper motions, energies, angular momenta of Milky Way dwarf galaxies: a recent infall to the Milky Way halo
Yang Y., Hammer F., Li H. et al.
No citations found for this paper.
Comments (0)