The miniJPAS survey quasar selection V: combined algorithm
Publication
Metrics
Paper Preview
Abstract
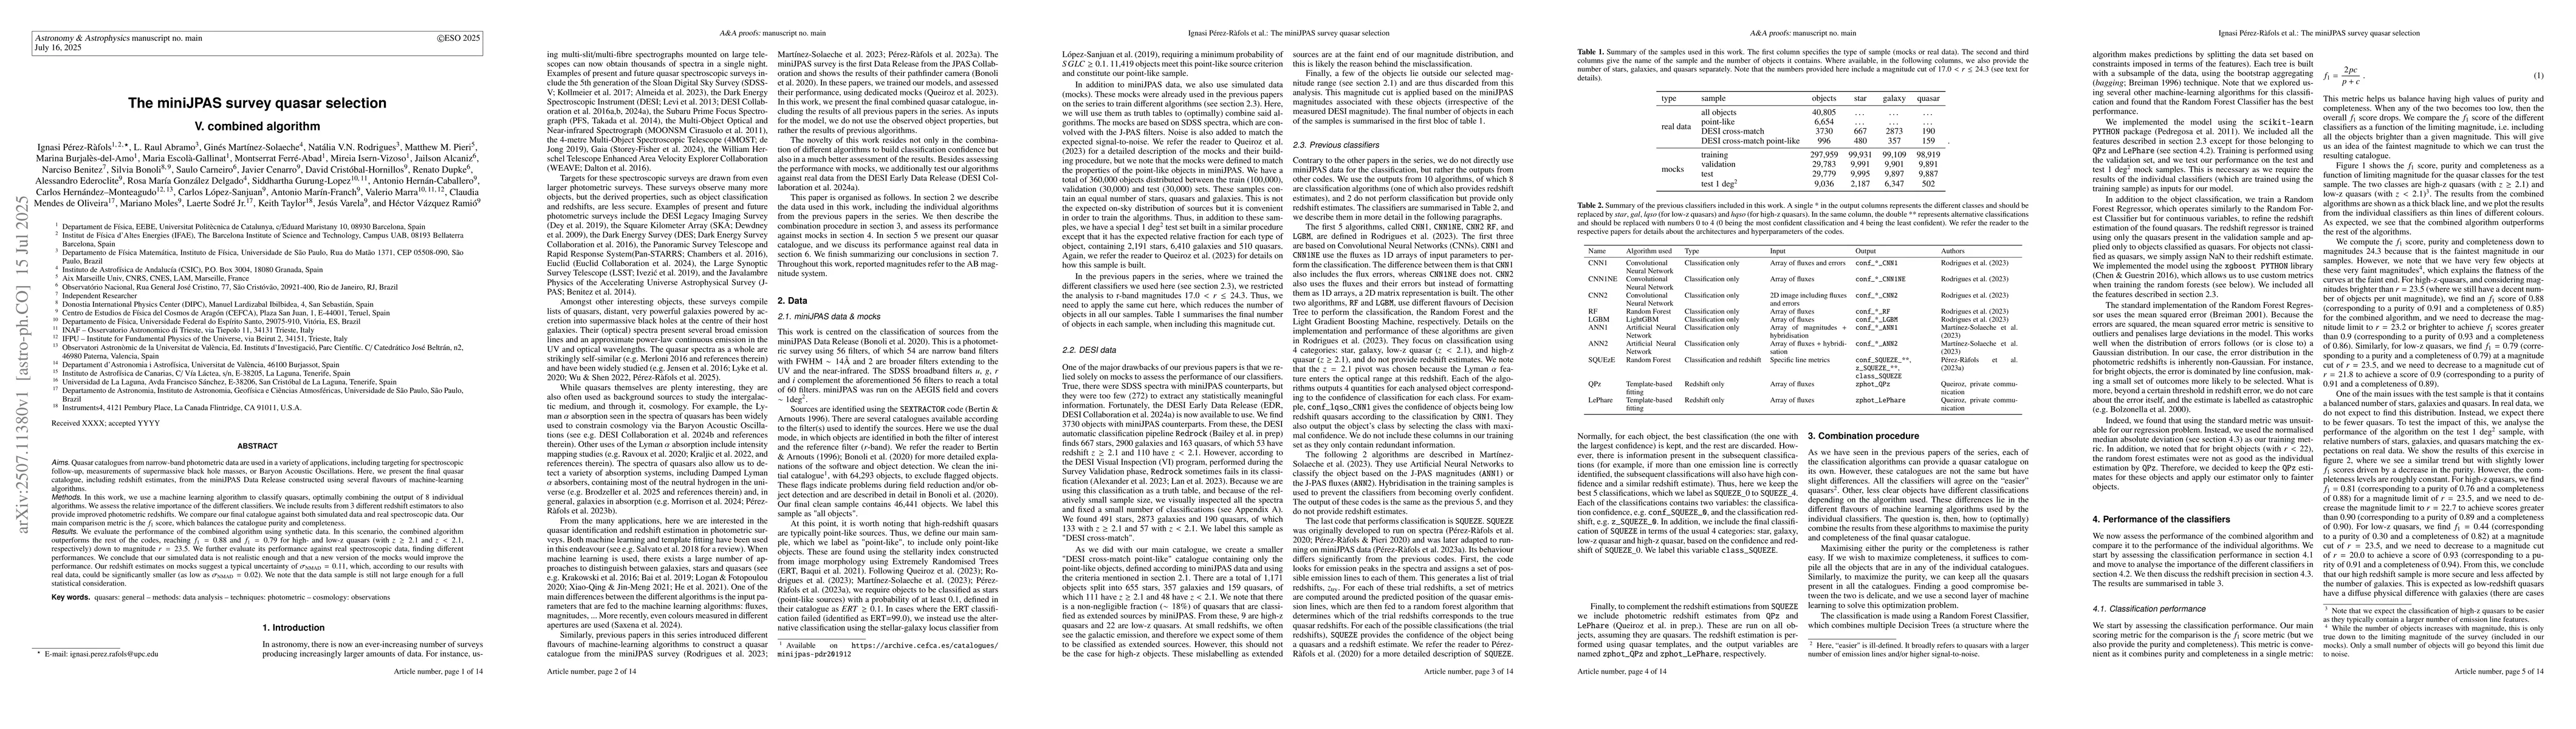
Aims. Quasar catalogues from narrow-band photometric data are used in a variety of applications, including targeting for spectroscopic follow-up, measurements of supermassive black hole masses, or Baryon Acoustic Oscillations. Here, we present the final quasar catalogue, including redshift estimates, from the miniJPAS Data Release constructed using several flavours of machine-learning algorithms. Methods. In this work, we use a machine learning algorithm to classify quasars, optimally combining the output of 8 individual algorithms. We assess the relative importance of the different classifiers. We include results from 3 different redshift estimators to also provide improved photometric redshifts. We compare our final catalogue against both simulated data and real spectroscopic data. Our main comparison metric is the $f_1$ score, which balances the catalogue purity and completeness. Results. We evaluate the performance of the combined algorithm using synthetic data. In this scenario, the combined algorithm outperforms the rest of the codes, reaching $f_1=0.88$ and $f_1=0.79$ for high- and low-z quasars (with $z\geq2.1$ and $z<2.1$, respectively) down to magnitude $r=23.5$. We further evaluate its performance against real spectroscopic data, finding different performances. We conclude that our simulated data is not realistic enough and that a new version of the mocks would improve the performance. Our redshift estimates on mocks suggest a typical uncertainty of $\sigma_{\rm NMAD} =0.11$, which, according to our results with real data, could be significantly smaller (as low as $\sigma_{\rm NMAD}=0.02$). We note that the data sample is still not large enough for a full statistical consideration.
AI Key Findings
Get AI-generated insights about this paper's methodology, results, significance, and more — seven facets brought into focus.
Impact
Paper Details
Authors
PDF Preview
Citation Network
Current paper (gray), citations (green), references (blue)
Display is limited for performance on very large graphs.
Discussion 0