Summary
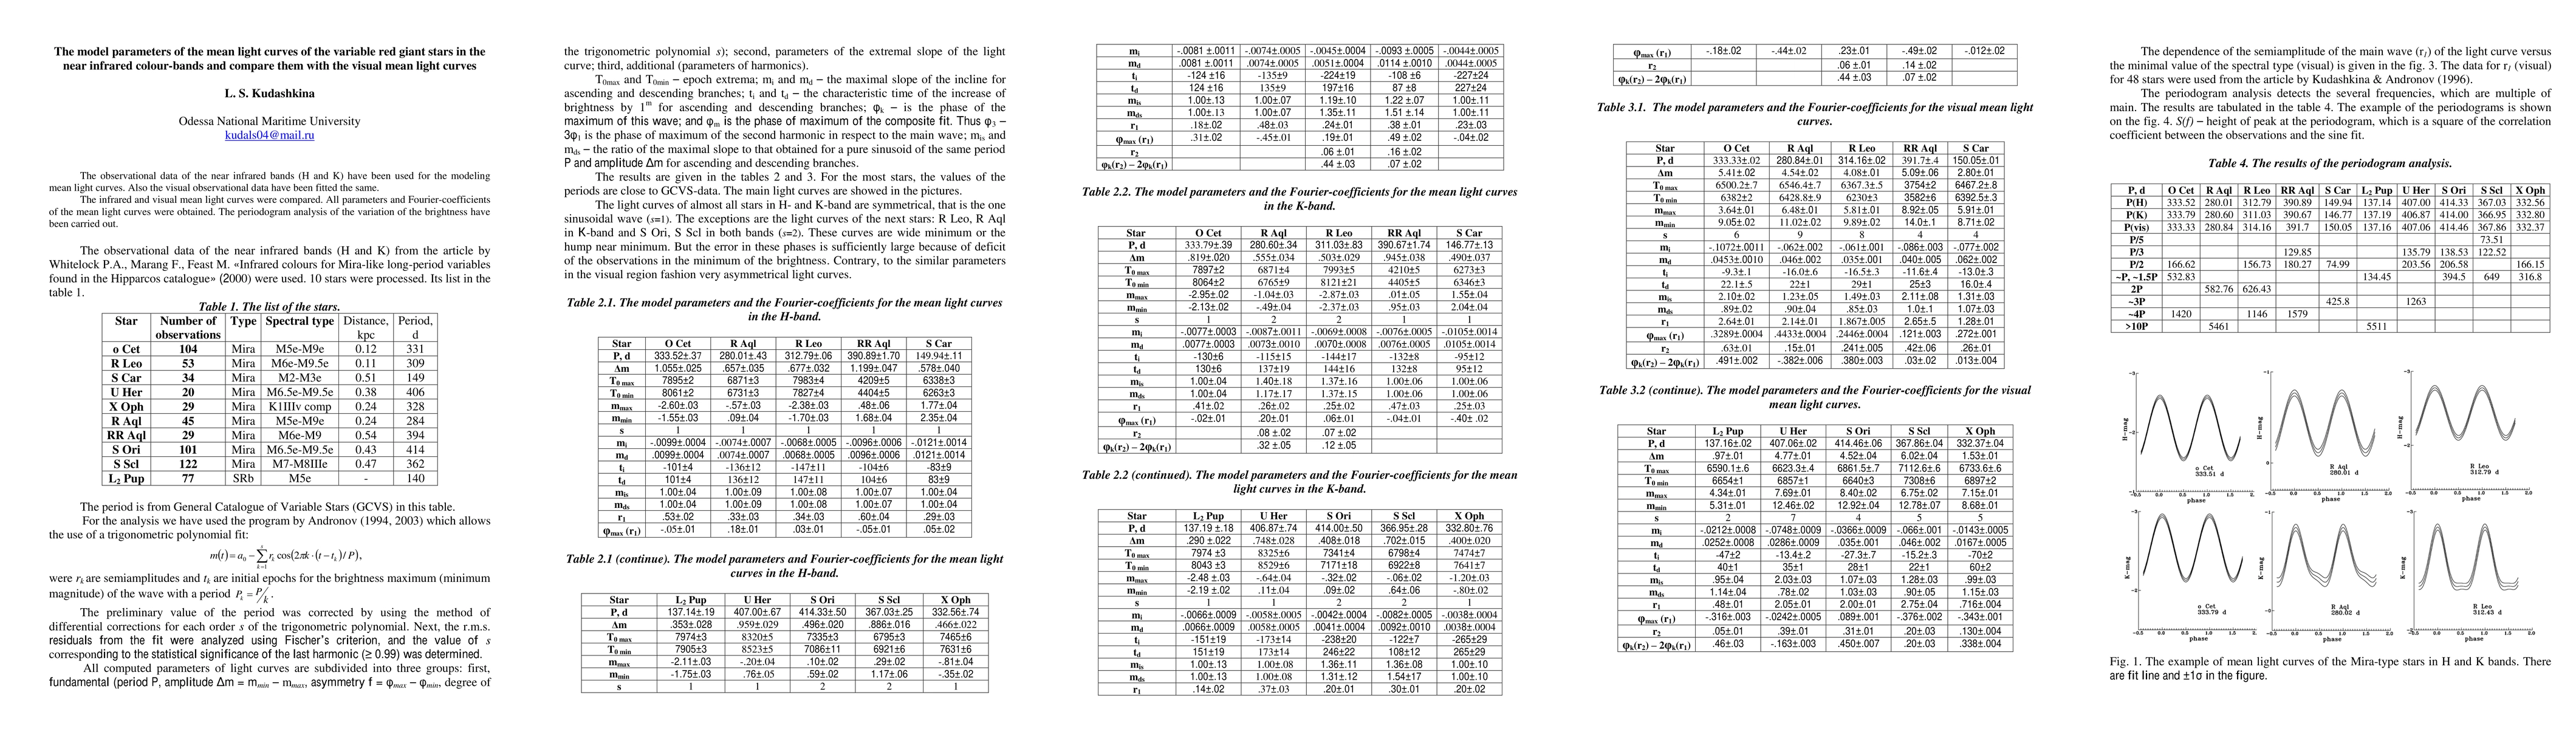
The observational data of the near infrared bands (H and K) have been used for the modeling mean light curves. Also the visual observational data have been fitted the same. The infrared and visual mean light curves were compared. All parameters and Fourier-coefficients of the mean light curves were obtained. The periodogram analysis of the variation of the brightness have been carried out.
AI Key Findings
Get AI-generated insights about this paper's methodology, results, and significance.
Paper Details
PDF Preview
Key Terms
light curves
(0.386)
observational data
(0.330)
curves
(0.304)
observational
(0.262)
mean
(0.261)
visual
(0.258)
infrared
(0.254)
light
(0.245)
Similar Papers
Found 4 papersNo citations found for this paper.
Comments (0)