Publication
Metrics
AI Quick Summary
This paper develops a data-driven model to analyze worker flows between firms using graph theory, modeling individuals as random walkers on graphs with employed or unemployed states. The model accurately captures labor mobility patterns in Mexico and Finland, suggesting potential for high-resolution labor mobility analysis and forecasting.
Paper Preview
Abstract
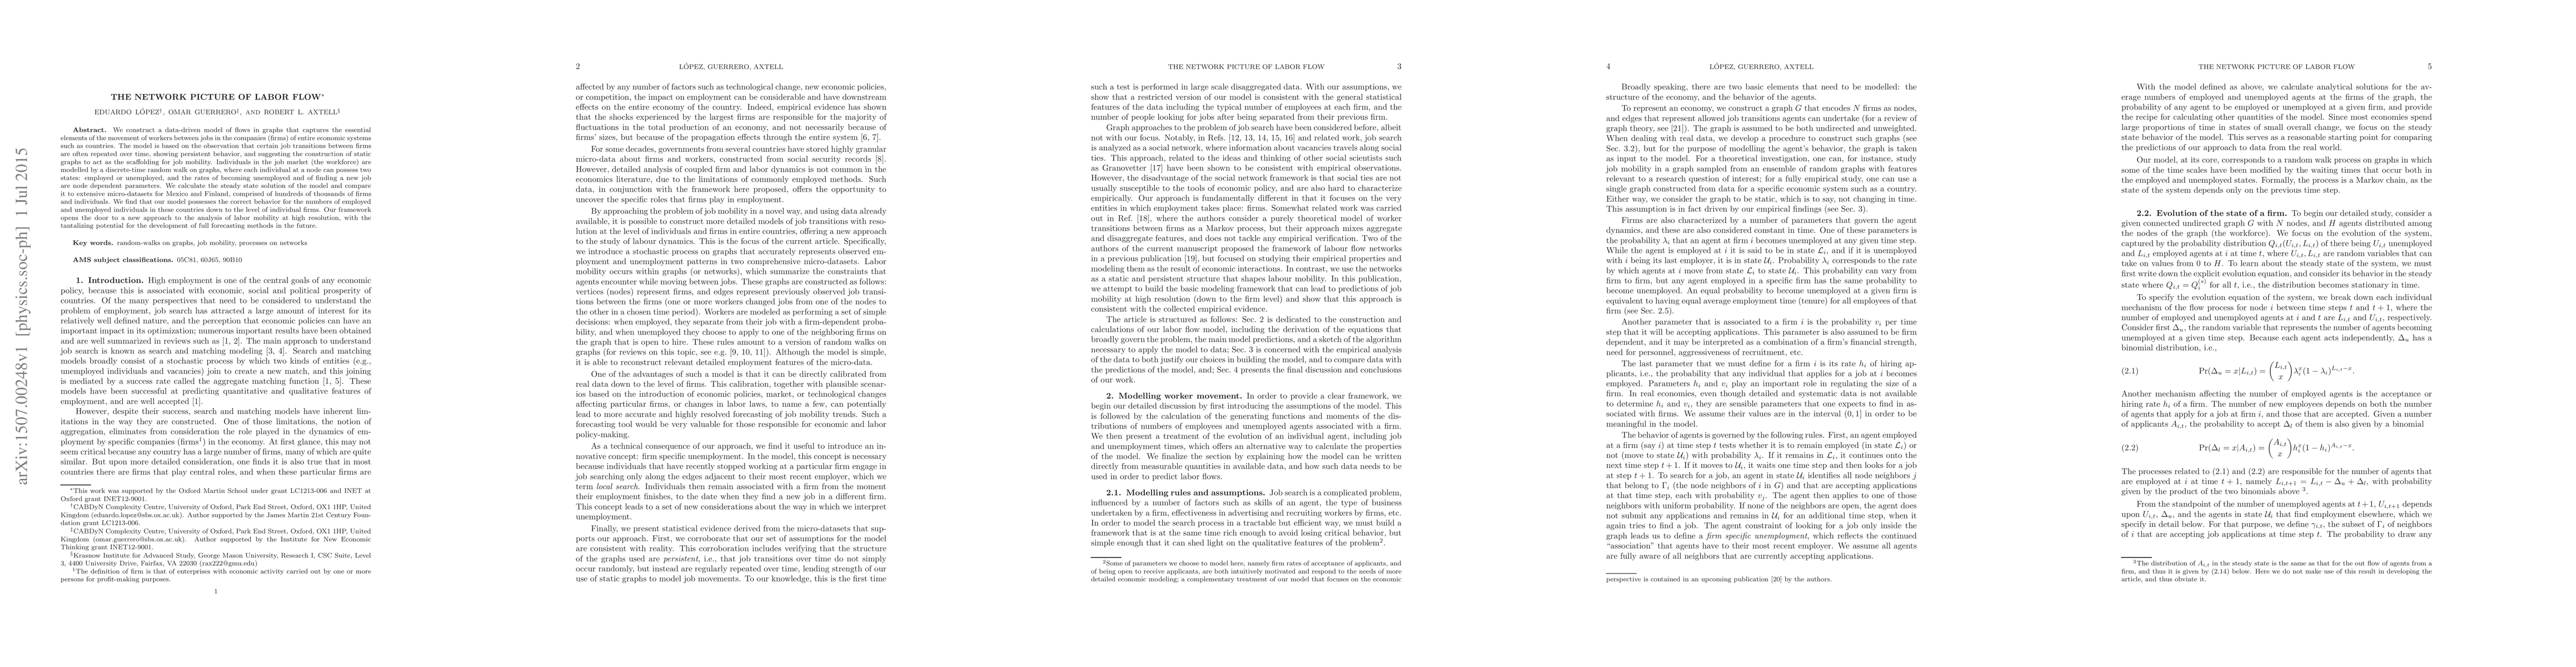
We construct a data-driven model of flows in graphs that captures the essential elements of the movement of workers between jobs in the companies (firms) of entire economic systems such as countries. The model is based on the observation that certain job transitions between firms are often repeated over time, showing persistent behavior, and suggesting the construction of static graphs to act as the scaffolding for job mobility. Individuals in the job market (the workforce) are modelled by a discrete-time random walk on graphs, where each individual at a node can possess two states: employed or unemployed, and the rates of becoming unemployed and of finding a new job are node dependent parameters. We calculate the steady state solution of the model and compare it to extensive micro-datasets for Mexico and Finland, comprised of hundreds of thousands of firms and individuals. We find that our model possesses the correct behavior for the numbers of employed and unemployed individuals in these countries down to the level of individual firms. Our framework opens the door to a new approach to the analysis of labor mobility at high resolution, with the tantalizing potential for the development of full forecasting methods in the future.
AI Key Findings
Get AI-generated insights about this paper's methodology, results, significance, and more — seven facets brought into focus.
Impact
Paper Details
Authors
PDF Preview
Key Terms
Citation Network
Current paper (gray), citations (green), references (blue)
Display is limited for performance on very large graphs.
Discussion 0