Summary
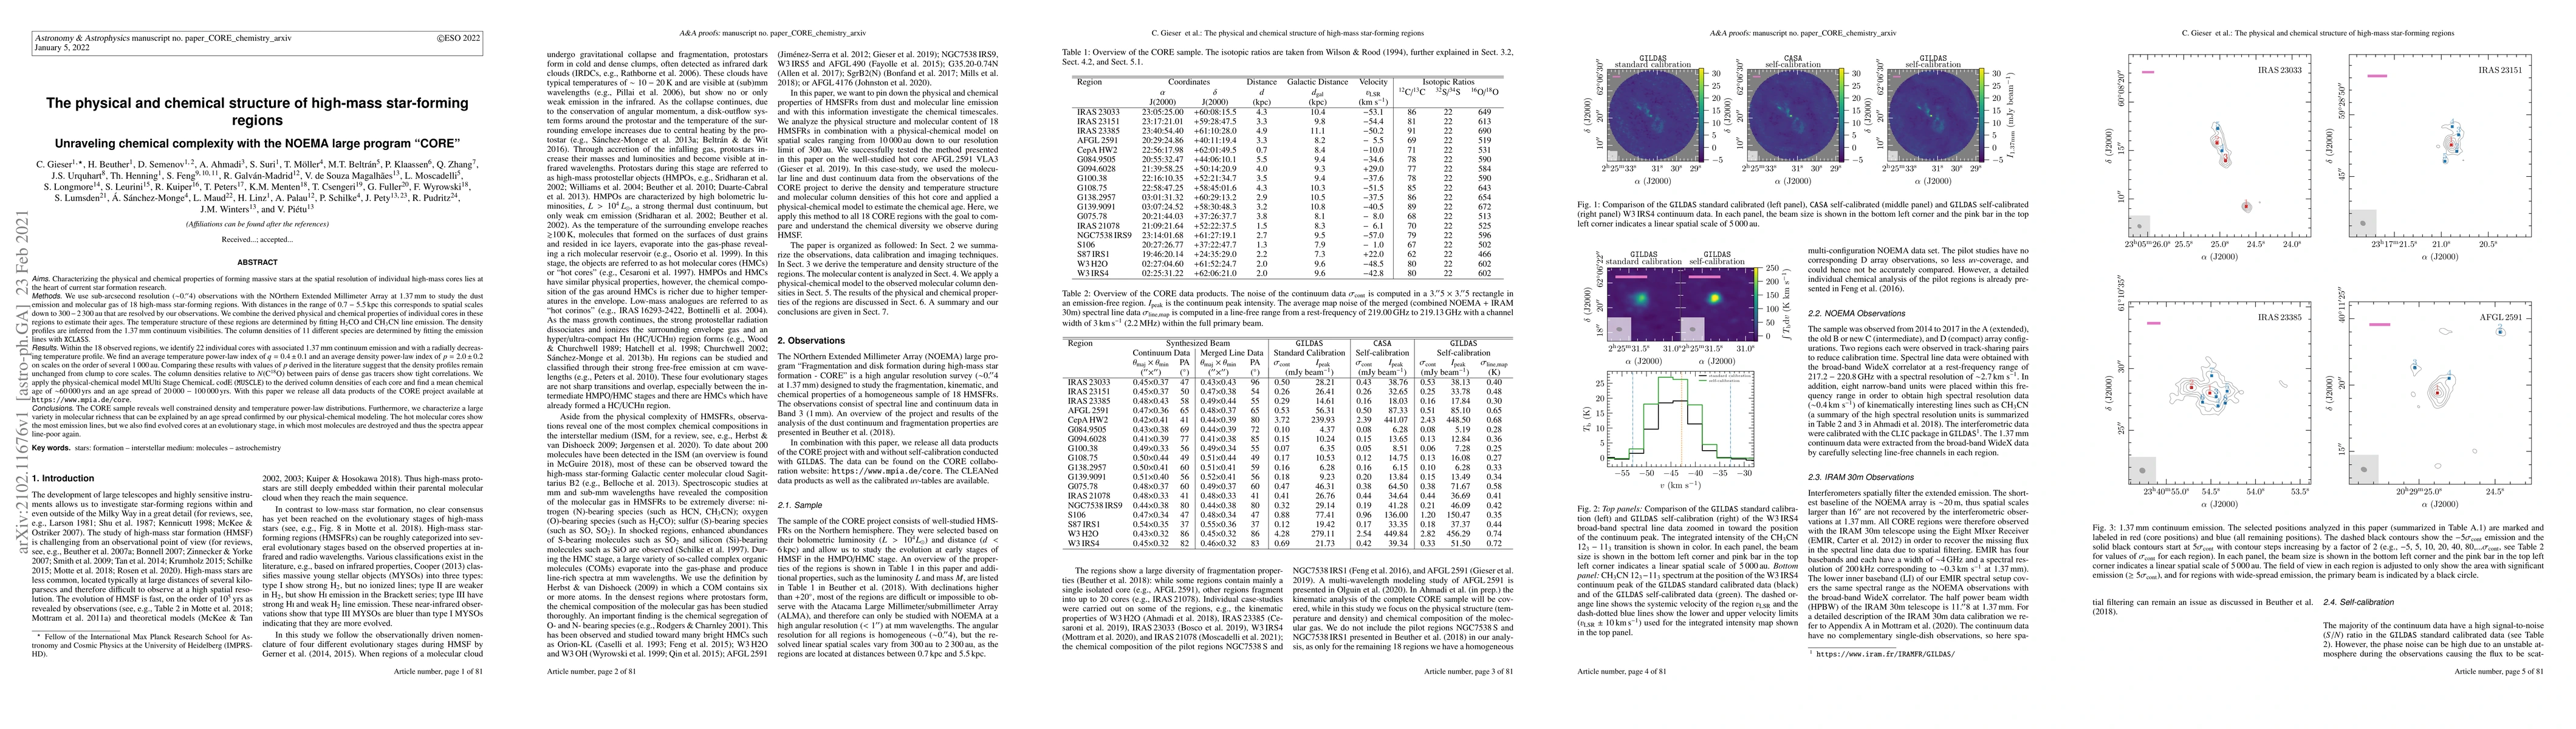
We use sub-arcsecond resolution ($\sim$0.4$''$) observations with NOEMA at 1.37 mm to study the dust emission and molecular gas of 18 high-mass star-forming regions. We combine the derived physical and chemical properties of individual cores in these regions to estimate their ages. The temperature structure of these regions are determined by fitting H2CO and CH3CN line emission. The density profiles are inferred from the 1.37 mm continuum visibilities. The column densities of 11 different species are determined by fitting the emission lines with XCLASS. Within the 18 observed regions, we identify 22 individual cores with associated 1.37 mm continuum emission and with a radially decreasing temperature profile. We find an average temperature power-law index of q = 0.4$\pm$0.1 and an average density power-law index of p = 2.0$\pm$0.2 on scales on the order of several 1 000 au. Comparing these results with values of p derived in the literature suggest that the density profiles remain unchanged from clump to core scales. The column densities relative to N(C18O) between pairs of dense gas tracers show tight correlations. We apply the physical-chemical model MUSCLE to the derived column densities of each core and find a mean chemical age of $\sim$60 000 yrs and an age spread of 20 000-100 000 yrs. With this paper we release all data products of the CORE project available at https://www.mpia.de/core. The CORE sample reveals well constrained density and temperature power-law distributions. Furthermore, we characterize a large variety in molecular richness that can be explained by an age spread confirmed by our physical-chemical modeling. The hot molecular cores show the most emission lines, but we also find evolved cores at an evolutionary stage, in which most molecules are destroyed and thus the spectra appear line-poor again.
AI Key Findings
Get AI-generated insights about this paper's methodology, results, and significance.
Paper Details
PDF Preview
Key Terms
Citation Network
Current paper (gray), citations (green), references (blue)
Display is limited for performance on very large graphs.
Similar Papers
Found 4 papersThe Chemical Clock of High-mass Star-forming Regions: N2H+/CCS
J. S. Zhang, Y. T. Yan, J. L. Chen et al.
Physical and chemical complexity in high-mass star-forming regions with ALMA. I. Overview and evolutionary trends of physical properties
Dmitry Semenov, Thomas Henning, Henrik Beuther et al.
| Title | Authors | Year | Actions |
|---|
Comments (0)