Summary
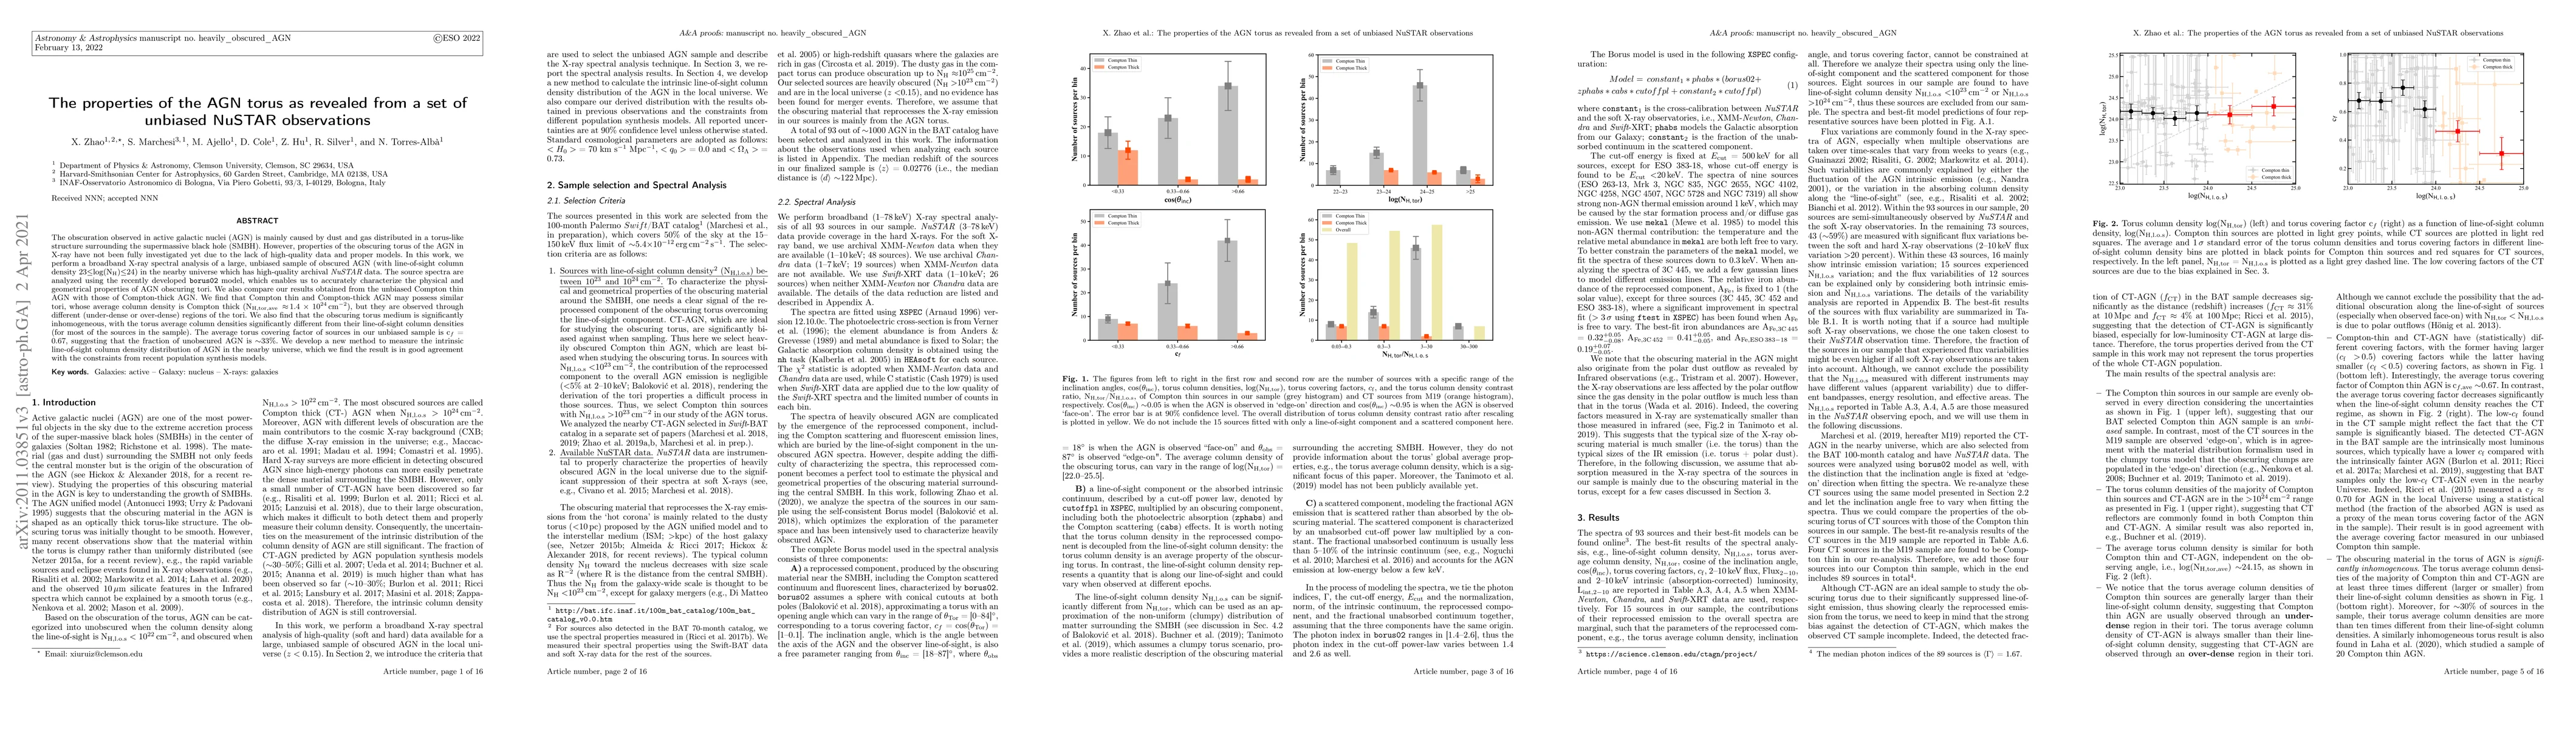
The obscuration observed in active galactic nuclei (AGN) is mainly caused by dust and gas distributed in a torus-like structure surrounding the supermassive black hole (SMBH). However, properties of the obscuring torus of the AGN in X-ray have not been fully investigated yet due to the lack of high-quality data and proper models. In this work, we perform a broadband X-ray spectral analysis of a large, unbiased sample of obscured AGN (with line-of-sight column density 23$\le$log(NH)$\le$24) in the nearby universe which has high-quality archival NuSTAR data. The source spectra are analyzed using the recently developed borus02 model, which enables us to accurately characterize the physical and geometrical properties of AGN obscuring tori. We also compare our results obtained from the unbiased Compton thin AGN with those of Compton-thick AGN. We find that Compton thin and Compton-thick AGN may possess similar tori, whose average column density is Compton thick (N$\rm _{H,tor,ave}$ $\sim$1.4$\times$10$^{24}$ cm$^{-2}$), but they are observed through different (under-dense or over-dense) regions of the tori. We also find that the obscuring torus medium is significantly inhomogeneous, with the torus average column densities significantly different from their line-of-sight column densities (for most of the sources in the sample). The average torus covering factor of sources in our unbiased sample is c$_f$=0.67, suggesting that the fraction of unobscured AGN is $\sim$33%. We develop a new method to measure the intrinsic line-of-sight column density distribution of AGN in the nearby universe, which we find the result is in good agreement with the constraints from recent population synthesis models.
AI Key Findings
Get AI-generated insights about this paper's methodology, results, and significance.
Paper Details
PDF Preview
Key Terms
Citation Network
Current paper (gray), citations (green), references (blue)
Display is limited for performance on very large graphs.
Similar Papers
Found 4 papers| Title | Authors | Year | Actions |
|---|
Comments (0)