Publication
Metrics
AI Quick Summary
This paper investigates the relationship between AGN variability and supermassive black hole properties using data from the QUEST-La Silla AGN variability survey and SDSS. It finds that variability amplitude inversely correlates with wavelength and accretion rate, while the variability gradient does not correlate significantly with black hole properties.
Paper Preview
Abstract
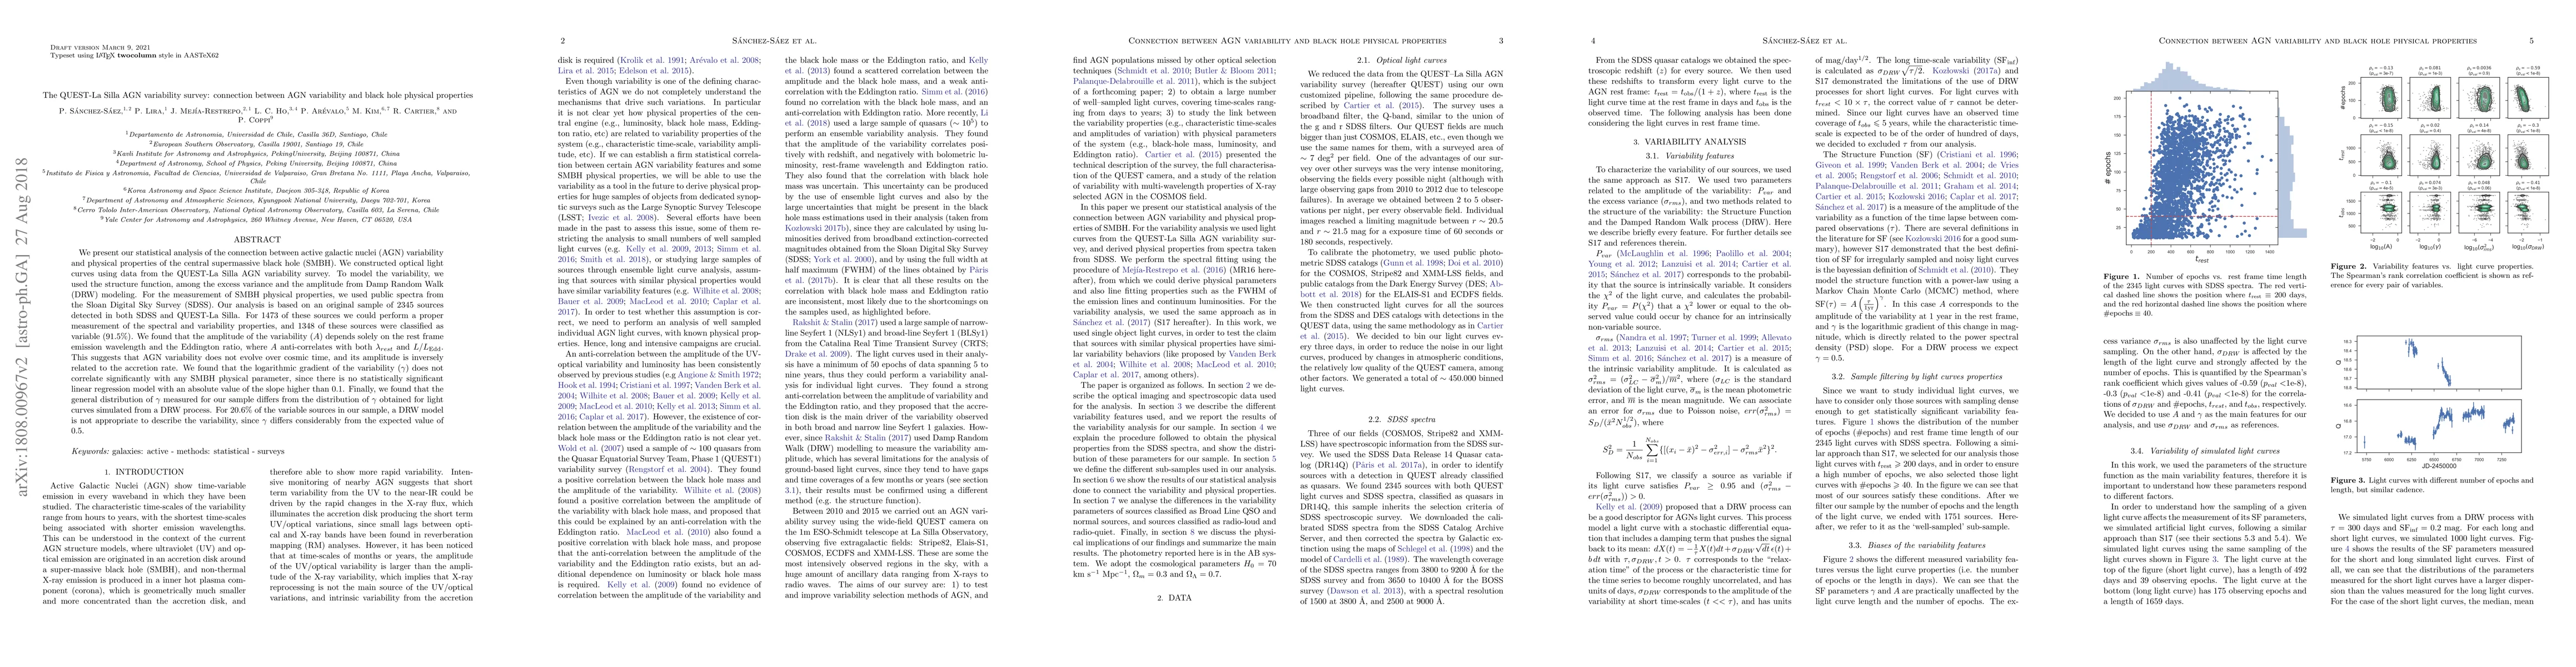
We present our statistical analysis of the connection between active galactic nuclei (AGN) variability and physical properties of the central supermassive black hole (SMBH). We constructed optical light curves using data from the QUEST-La Silla AGN variability survey. To model the variability, we used the structure function, among the excess variance and the amplitude from Damp Random Walk (DRW) modeling. For the measurement of SMBH physical properties, we used public spectra from the Sloan Digital Sky Survey (SDSS). Our analysis is based on an original sample of 2345 sources detected in both SDSS and QUEST-La Silla. For 1473 of these sources we could perform a proper measurement of the spectral and variability properties, and 1348 of these sources were classified as variable ($91.5\%$). We found that the amplitude of the variability ($A$) depends solely on the rest frame emission wavelength and the Eddington ratio, where $A$ anti-correlates with both $\lambda_{rest}$ and $L/L_{\text{Edd}}$. This suggests that AGN variability does not evolve over cosmic time, and its amplitude is inversely related to the accretion rate. We found that the logarithmic gradient of the variability ($\gamma$) does not correlate significantly with any SMBH physical parameter, since there is no statistically significant linear regression model with an absolute value of the slope higher than 0.1. Finally, we found that the general distribution of $\gamma$ measured for our sample differs from the distribution of $\gamma$ obtained for light curves simulated from a DRW process. For 20.6\% of the variable sources in our sample, a DRW model is not appropriate to describe the variability, since $\gamma$ differs considerably from the expected value of 0.5.
AI Key Findings
Get AI-generated insights about this paper's methodology, results, significance, and more — seven facets brought into focus.
Impact
Paper Details
PDF Preview
Key Terms
Citation Network
Current paper (gray), citations (green), references (blue)
Display is limited for performance on very large graphs.
Discussion 0