Summary
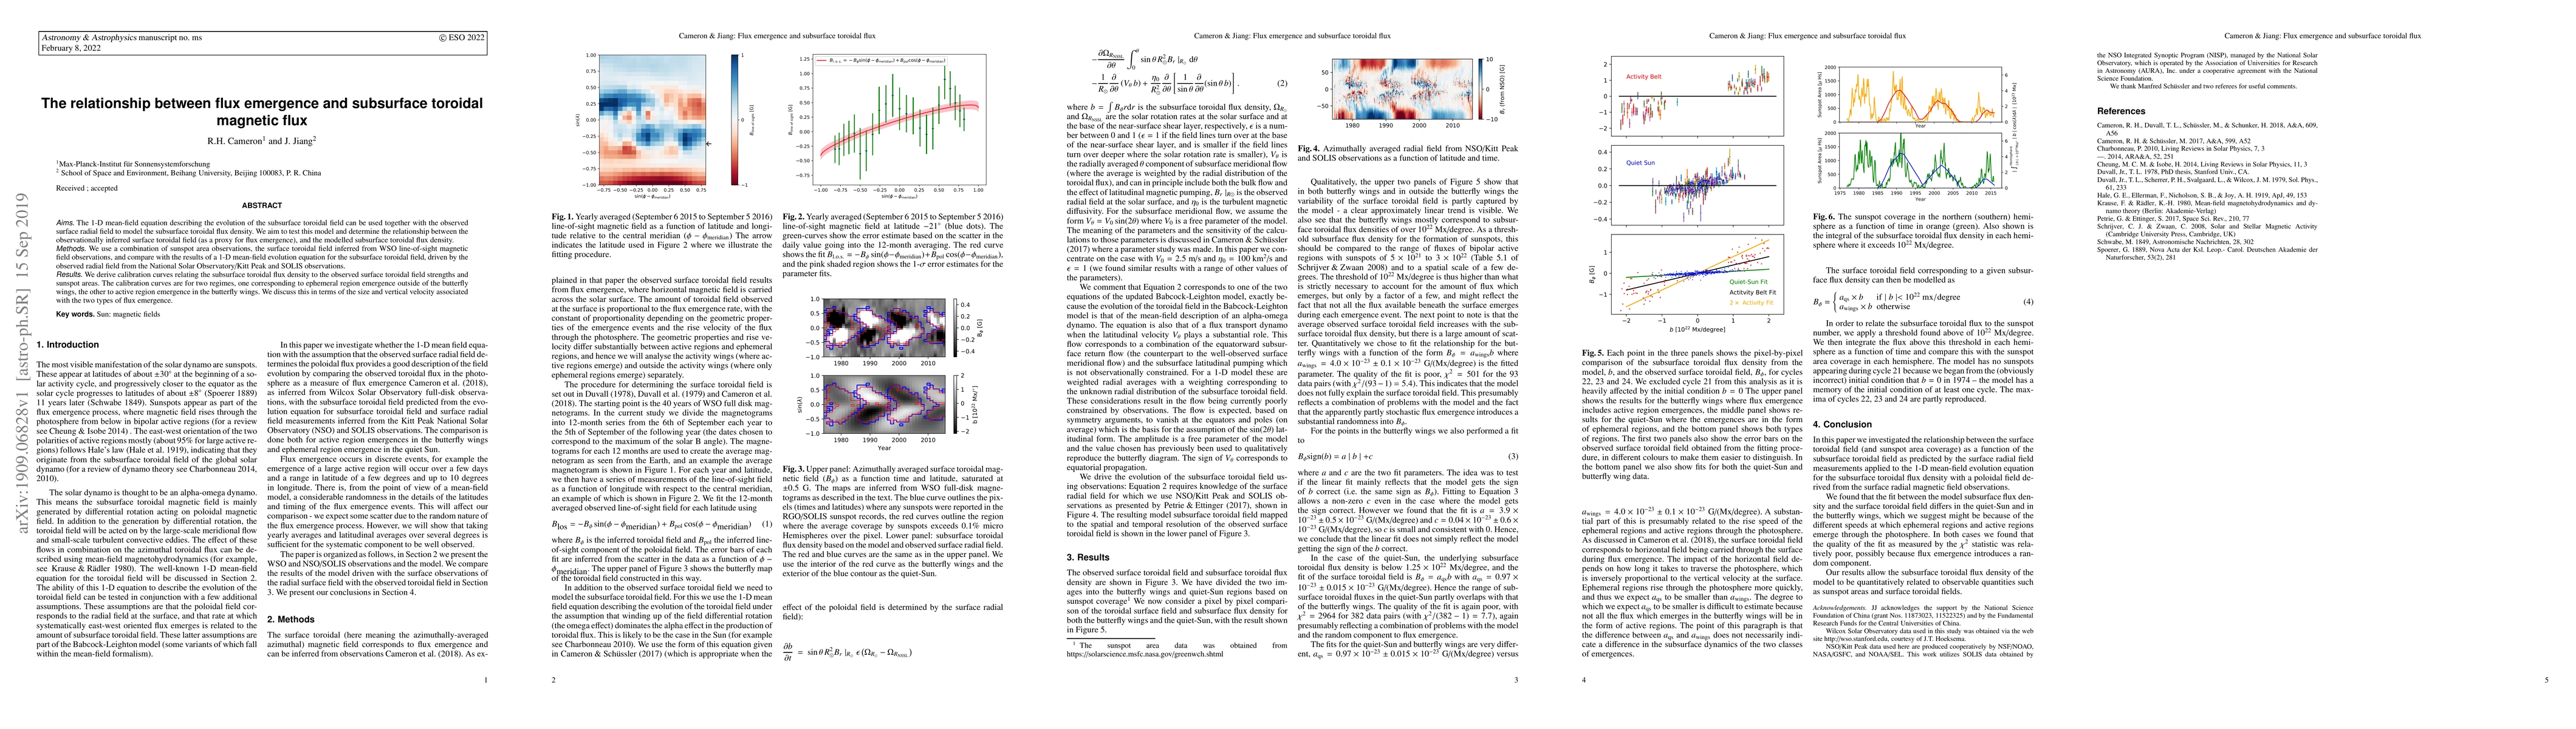
The 1-D mean-field equation describing the evolution of the subsurface toroidal field can be used together with the observed surface radial field to model the subsurface toroidal flux density. We aim to test this model and determine the relationship between the observationally inferred surface toroidal field (as a proxy for flux emergence), and the modelled subsurface toroidal flux density. We use a combination of sunspot area observations, the surface toroidal field inferred from WSO line-of-sight magnetic field observations, and compare with the results of a 1-D mean-field evolution equation for the subsurface toroidal field, driven by the observed radial field from the National Solar Observatory/Kitt Peak and SOLIS observations. We derive calibration curves relating the subsurface toroidal flux density to the observed surface toroidal field strengths and sunspot areas. The calibration curves are for two regimes, one corresponding to ephemeral region emergence outside of the butterfly wings, the other to active region emergence in the butterfly wings. We discuss this in terms of the size and vertical velocity associated with the two types of flux emergence.
AI Key Findings
Get AI-generated insights about this paper's methodology, results, and significance.
Paper Details
PDF Preview
Key Terms
Citation Network
Current paper (gray), citations (green), references (blue)
Display is limited for performance on very large graphs.
Similar Papers
Found 4 papersRecurrent eruptions from the emergence of a toroidal flux tube
K. Moraitis, V. Archontis, J. Zhuleku
| Title | Authors | Year | Actions |
|---|
Comments (0)