Publication
Metrics
AI Quick Summary
This paper investigates the morphology of the richest superclusters using data from the 2dF Galaxy Redshift Survey and compares it with model superclusters from the Millennium Simulation. It finds that rich superclusters exhibit elongated, filamentary shapes with dense core regions, characterized by higher clumpiness quantified by the fourth Minkowski functional $V_3$.
Paper Preview
Abstract
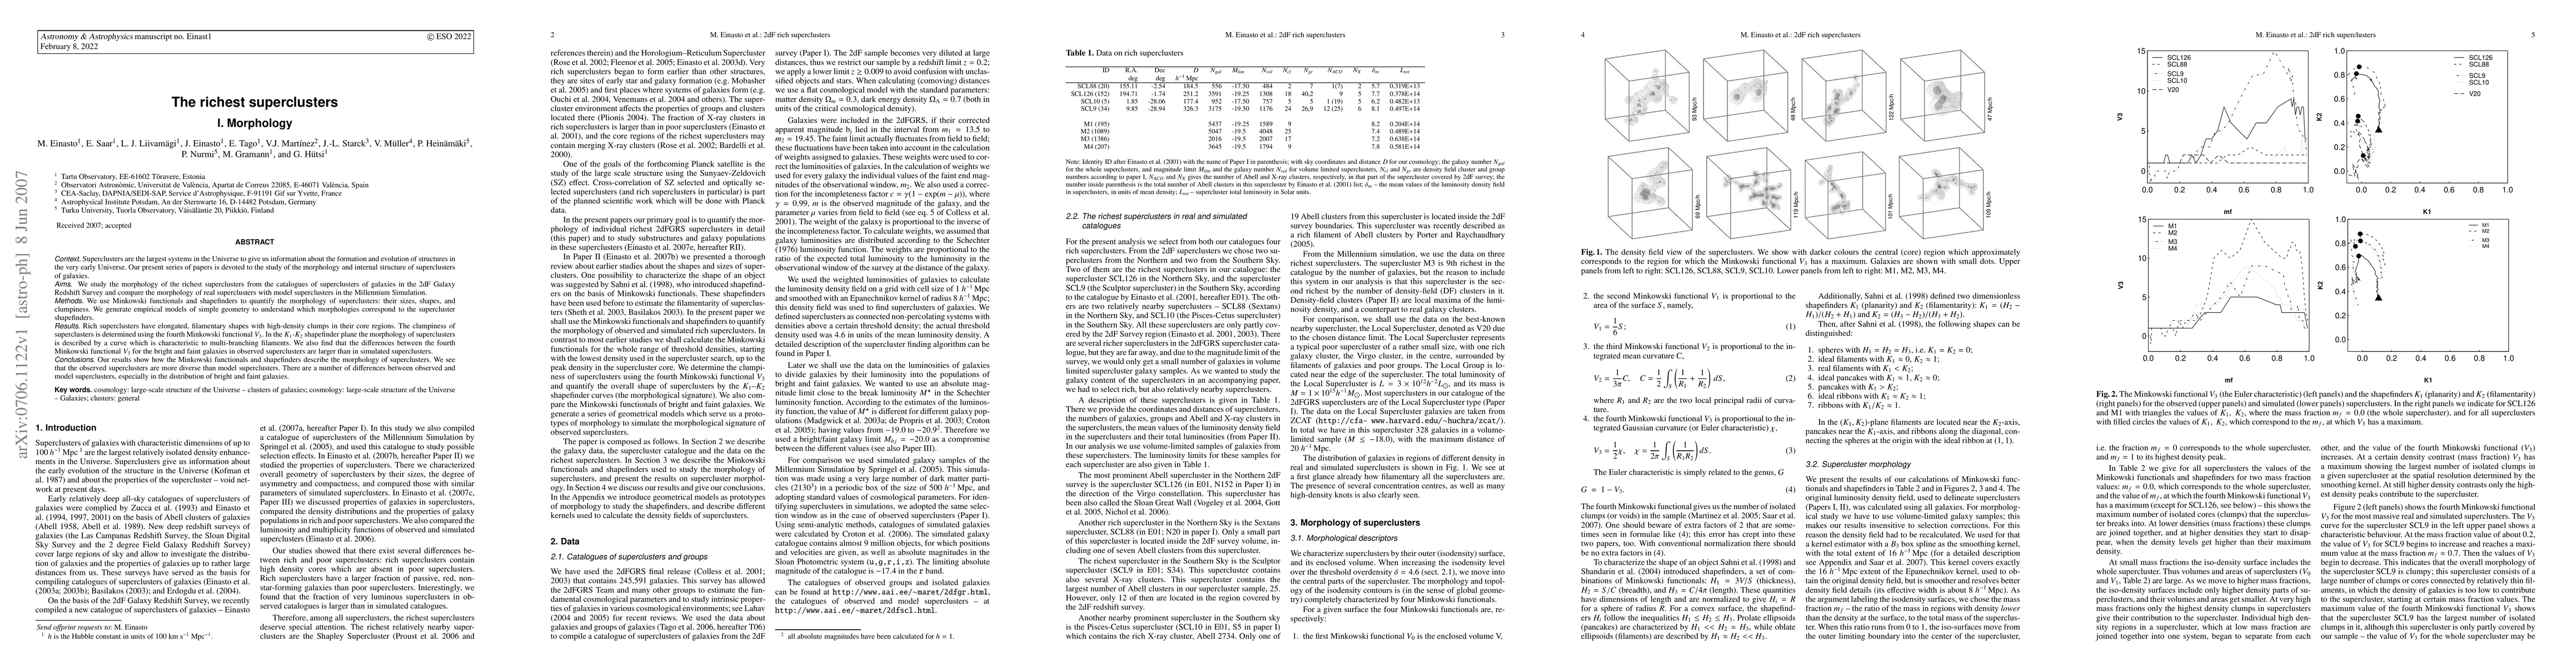
We study the morphology of the richest superclusters from the catalogues of superclusters of galaxies in the 2dF Galaxy Redshift Survey and compare the morphology of real superclusters with model superclusters in the Millennium Simulation. We use Minkowski functionals and shapefinders to quantify the morphology of superclusters: their sizes, shapes, and clumpiness. We generate empirical models of simple geometry to understand which morphologies correspond to the supercluster shapefinders. We show that rich superclusters have elongated, filamentary shapes with high-density clumps in their core regions. The clumpiness of superclusters is determined using the fourth Minkowski functional $V_3$. In the $K_1$-$K_2$ shapefinder plane the morphology of superclusters is described by a curve which is characteristic to multi-branching filaments. We also find that the differences between the fourth Minkowski functional $V_3$ for the bright and faint galaxies in observed superclusters are larger than in simulated superclusters.
AI Key Findings
Get AI-generated insights about this paper's methodology, results, significance, and more — seven facets brought into focus.
Impact
Paper Details
PDF Preview
Key Terms
Citation Network
Current paper (gray), citations (green), references (blue)
Display is limited for performance on very large graphs.
Discussion 0