Publication
Metrics
AI Quick Summary
This paper explores risk stratification through the risk distribution curve, deriving the ROC curve and other risk stratification metrics from it. It provides a mathematical expression for the ROC curve AUC, illustrating the positive correlation between the dispersion of the risk distribution curve and the AUC, which enhances the understanding of superior risk stratification.
Paper Preview
Abstract
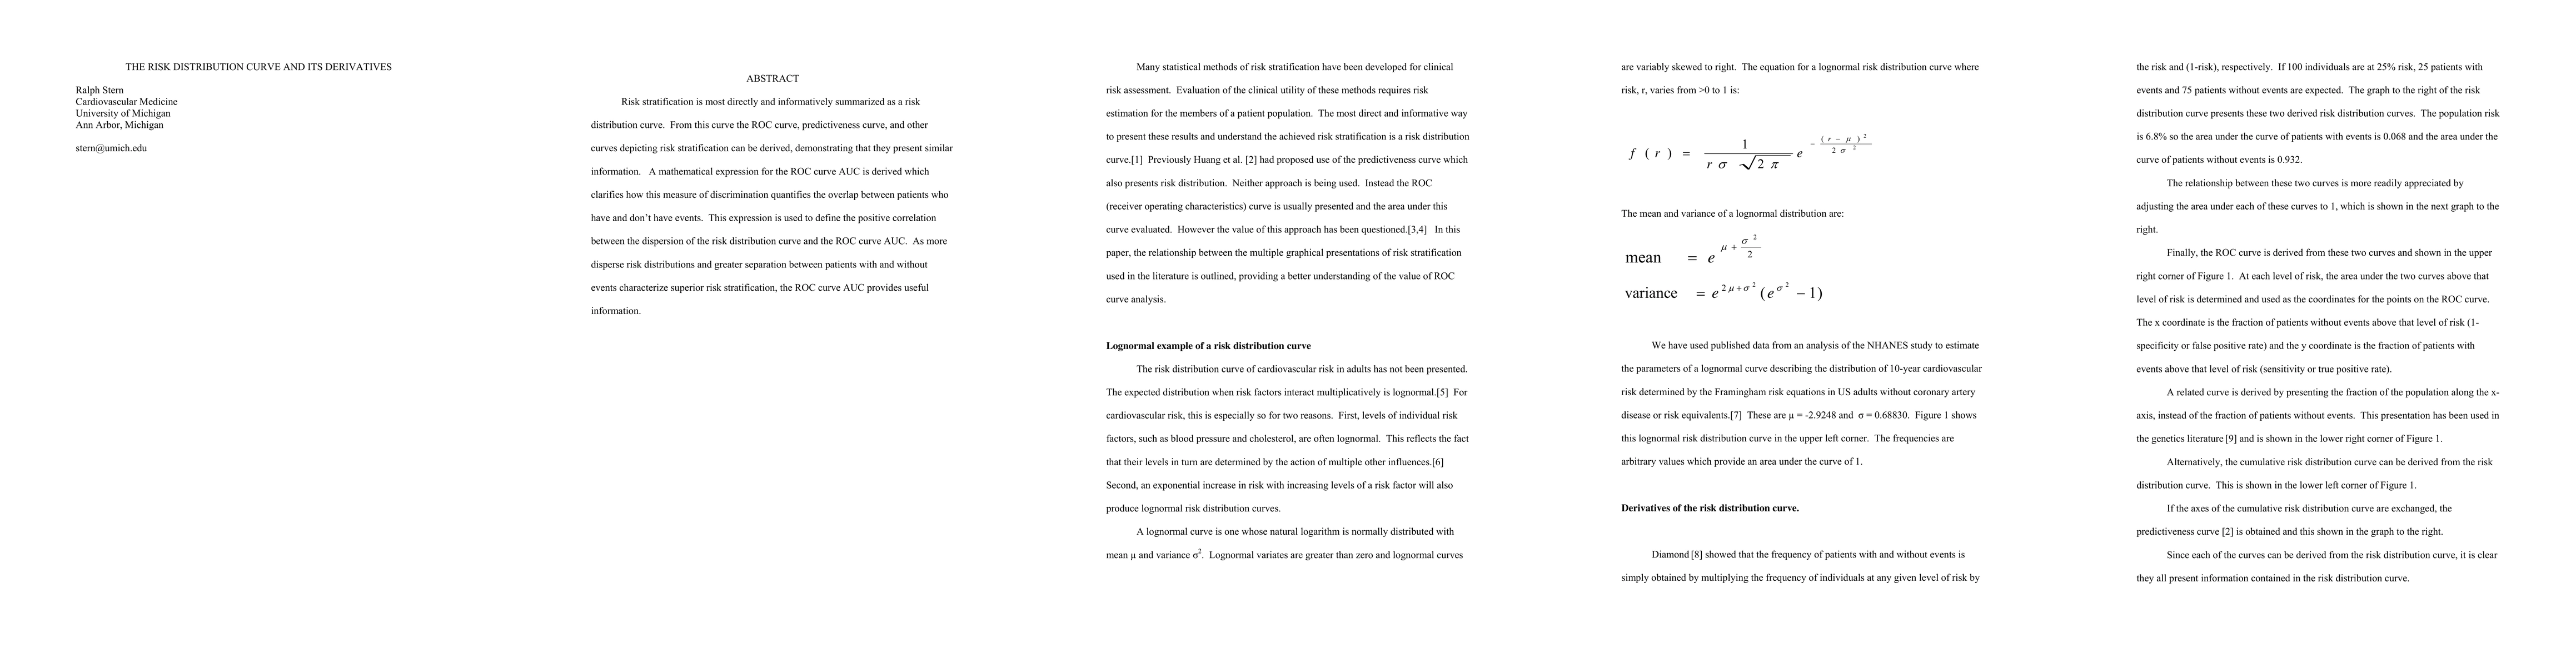
Risk stratification is most directly and informatively summarized as a risk distribution curve. From this curve the ROC curve, predictiveness curve, and other curves depicting risk stratification can be derived, demonstrating that they present similar information. A mathematical expression for the ROC curve AUC is derived which clarifies how this measure of discrimination quantifies the overlap between patients who have and don't have events. This expression is used to define the positive correlation between the dispersion of the risk distribution curve and the ROC curve AUC. As more disperse risk distributions and greater separation between patients with and without events characterize superior risk stratification, the ROC curve AUC provides useful information.
AI Key Findings
Get AI-generated insights about this paper's methodology, results, significance, and more — seven facets brought into focus.
Impact
Paper Details
PDF Preview
Key Terms
Citation Network
Current paper (gray), citations (green), references (blue)
Display is limited for performance on very large graphs.
Discussion 0