Publication
Metrics
AI Quick Summary
A 1971-2000 study finds that countries' export diversity and economic size follow an S-shaped relationship, with poor countries exporting few goods, rich countries reaching a ceiling, and mid-tier countries experiencing dramatic increases in diversity. The findings suggest three stages of economic growth linked to export diversity.
Paper Preview
Abstract
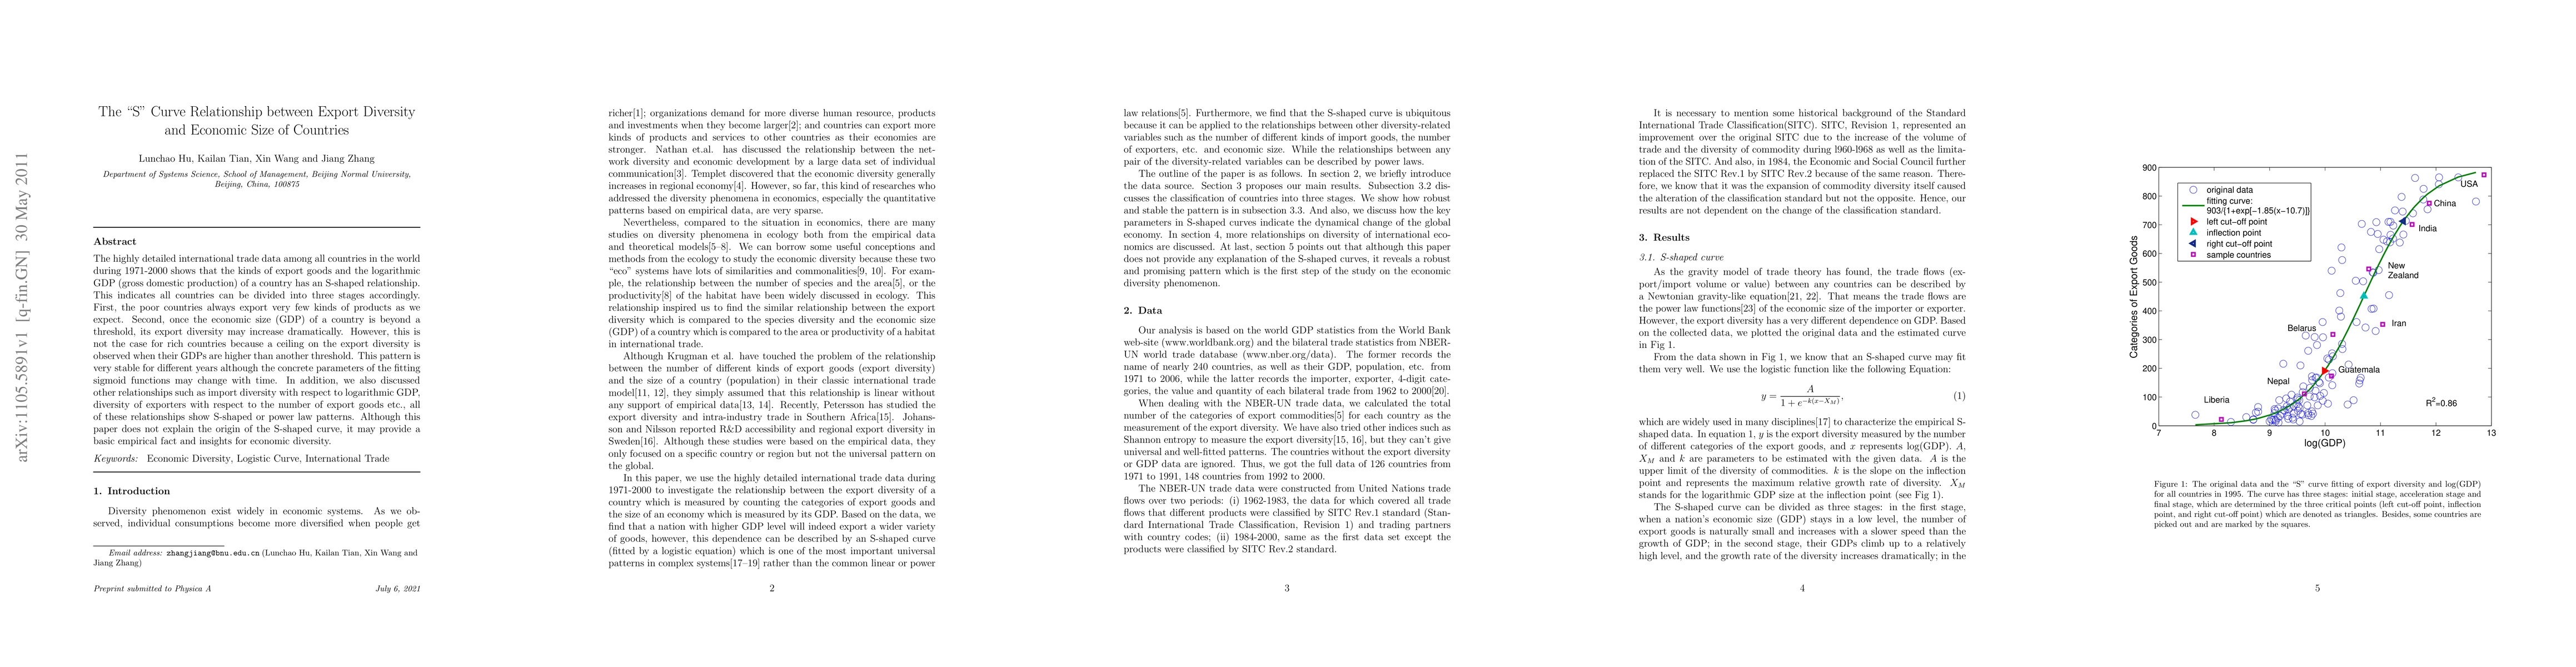
The highly detailed international trade data among all countries in the world during 1971-2000 shows that the kinds of export goods and the logarithmic GDP (gross domestic production) of a country has an S-shaped relationship. This indicates all countries can be divided into three stages accordingly. First, the poor countries always export very few kinds of products as we expect. Second, once the economic size (GDP) of a country is beyond a threshold, its export diversity may increase dramatically. However, this is not the case for rich countries because a ceiling on the export diversity is observed when their GDPs are higher than another threshold. This pattern is very stable for different years although the concrete parameters of the fitting sigmoid functions may change with time. In addition, we also discussed other relationships such as import diversity with respect to logarithmic GDP, diversity of exporters with respect to the number of export goods etc., all of these relationships show S-shaped or power law patterns. Although this paper does not explain the origin of the S-shaped curve, it may provide a basic empirical fact and insights for economic diversity.
AI Key Findings
Get AI-generated insights about this paper's methodology, results, significance, and more — seven facets brought into focus.
Impact
Paper Details
PDF Preview
Key Terms
Citation Network
Current paper (gray), citations (green), references (blue)
Display is limited for performance on very large graphs.
Discussion 0