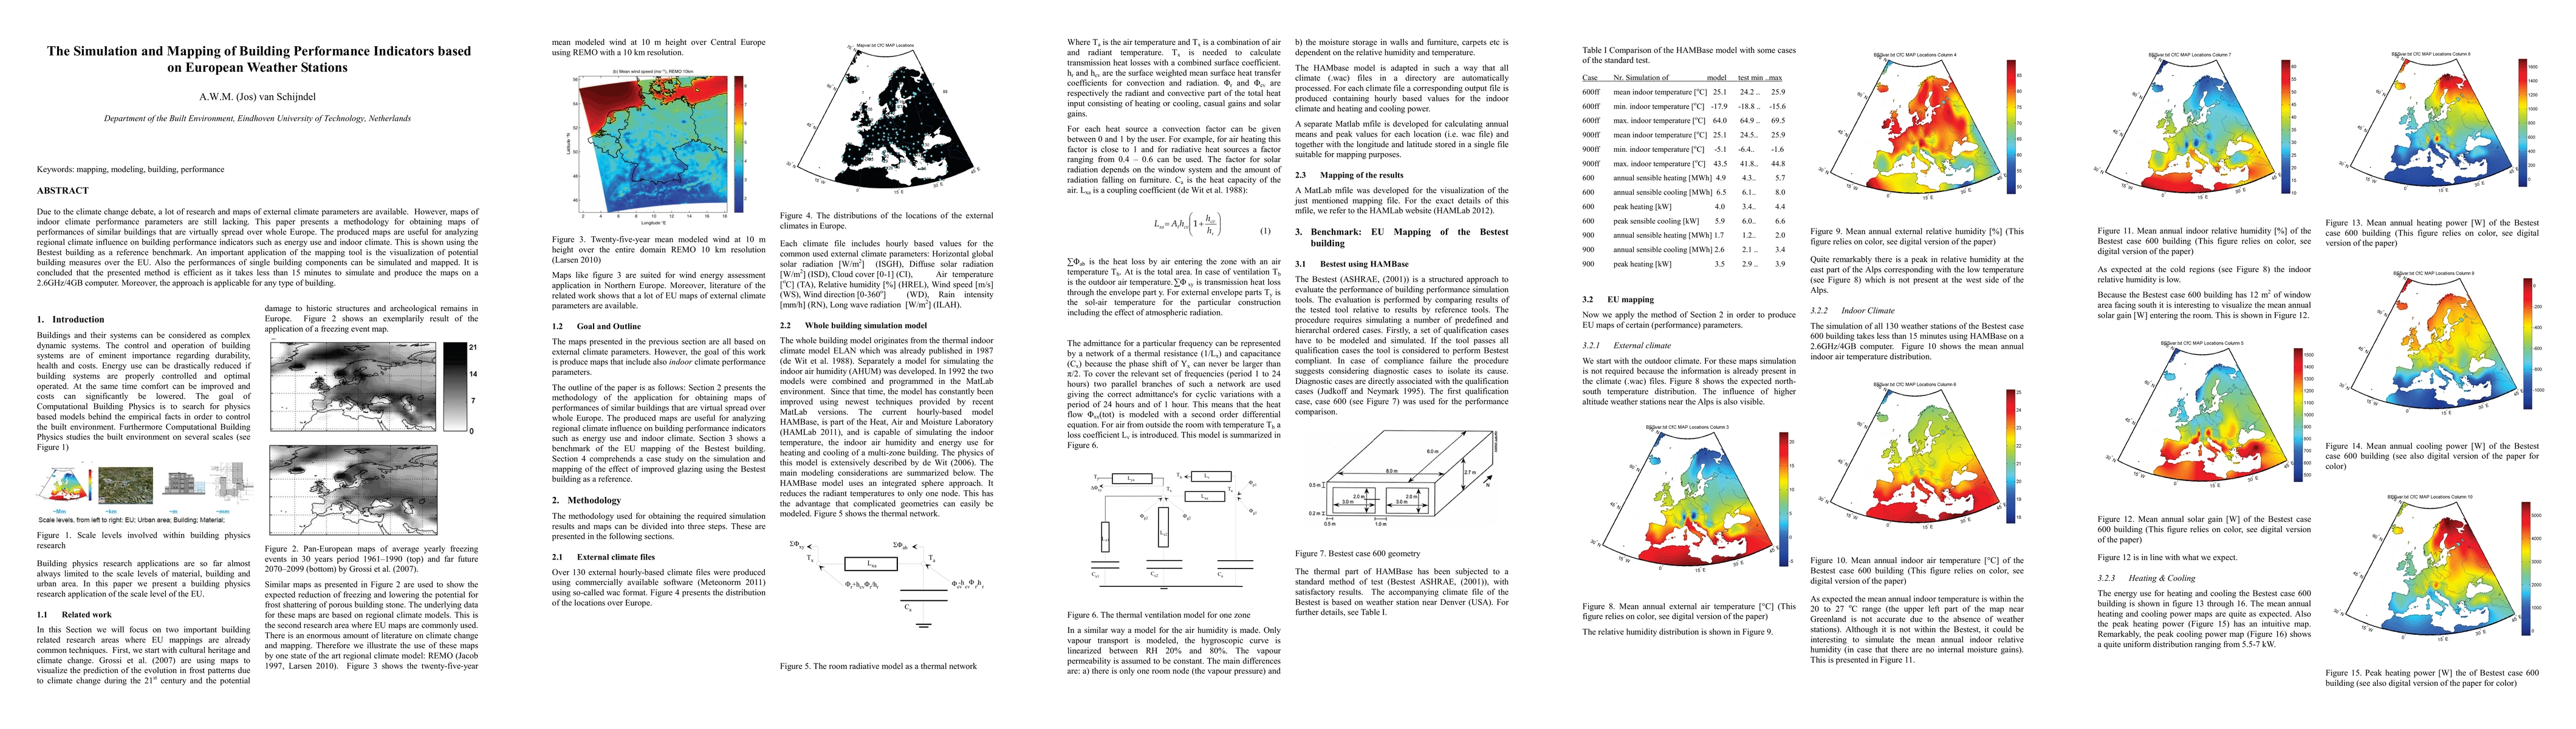
The Simulation and Mapping of Building Performance Indicators based on European Weather Stations
Publication
Metrics
AI Quick Summary
This paper introduces a method to create maps of building performance indicators across Europe, using weather station data. The approach efficiently simulates and visualizes energy use, indoor climate, and component performance, taking less than 15 minutes per building on a standard computer. It's applicable to all building types, aiding in assessing climate impacts and potential building measures across the EU.
Paper Preview
Abstract
Due to the climate change debate, a lot of research and maps of external climate parameters are available. However, maps of indoor climate performance parameters are still lacking. This paper presents a methodology for obtaining maps of performances of similar buildings that are virtually spread over whole Europe. The produced maps are useful for analyzing regional climate influence on building performance indicators such as energy use and indoor climate. This is shown using the Bestest building as a reference benchmark. An important application of the mapping tool is the visualization of potential building measures over the EU. Also the performances of single building components can be simulated and mapped. It is concluded that the presented method is efficient as it takes less than 15 minutes to simulate and produce the maps on a 2.6GHz/4GB computer. Moreover, the approach is applicable for any type of building.
AI Key Findings
Get AI-generated insights about this paper's methodology, results, significance, and more — seven facets brought into focus.
Impact
Paper Details
PDF Preview
Key Terms
Citation Network
Current paper (gray), citations (green), references (blue)
Display is limited for performance on very large graphs.
Discussion 0