Publication
Metrics
AI Quick Summary
This study uses the abundance matching method to show a linear relation between the half-mass radius of galaxies' stellar distributions and their virial radii, R200, across a wide range of stellar masses and morphological types. The relation, rhalf ~ 0.015R200, aligns with halo angular momentum models, implying that galaxy sizes and baryonic distribution are primarily determined by their parent halo's properties, with late and early-type galaxies displaying similar mean stellar surface density profiles beyond a certain radius.
Paper Preview
Abstract
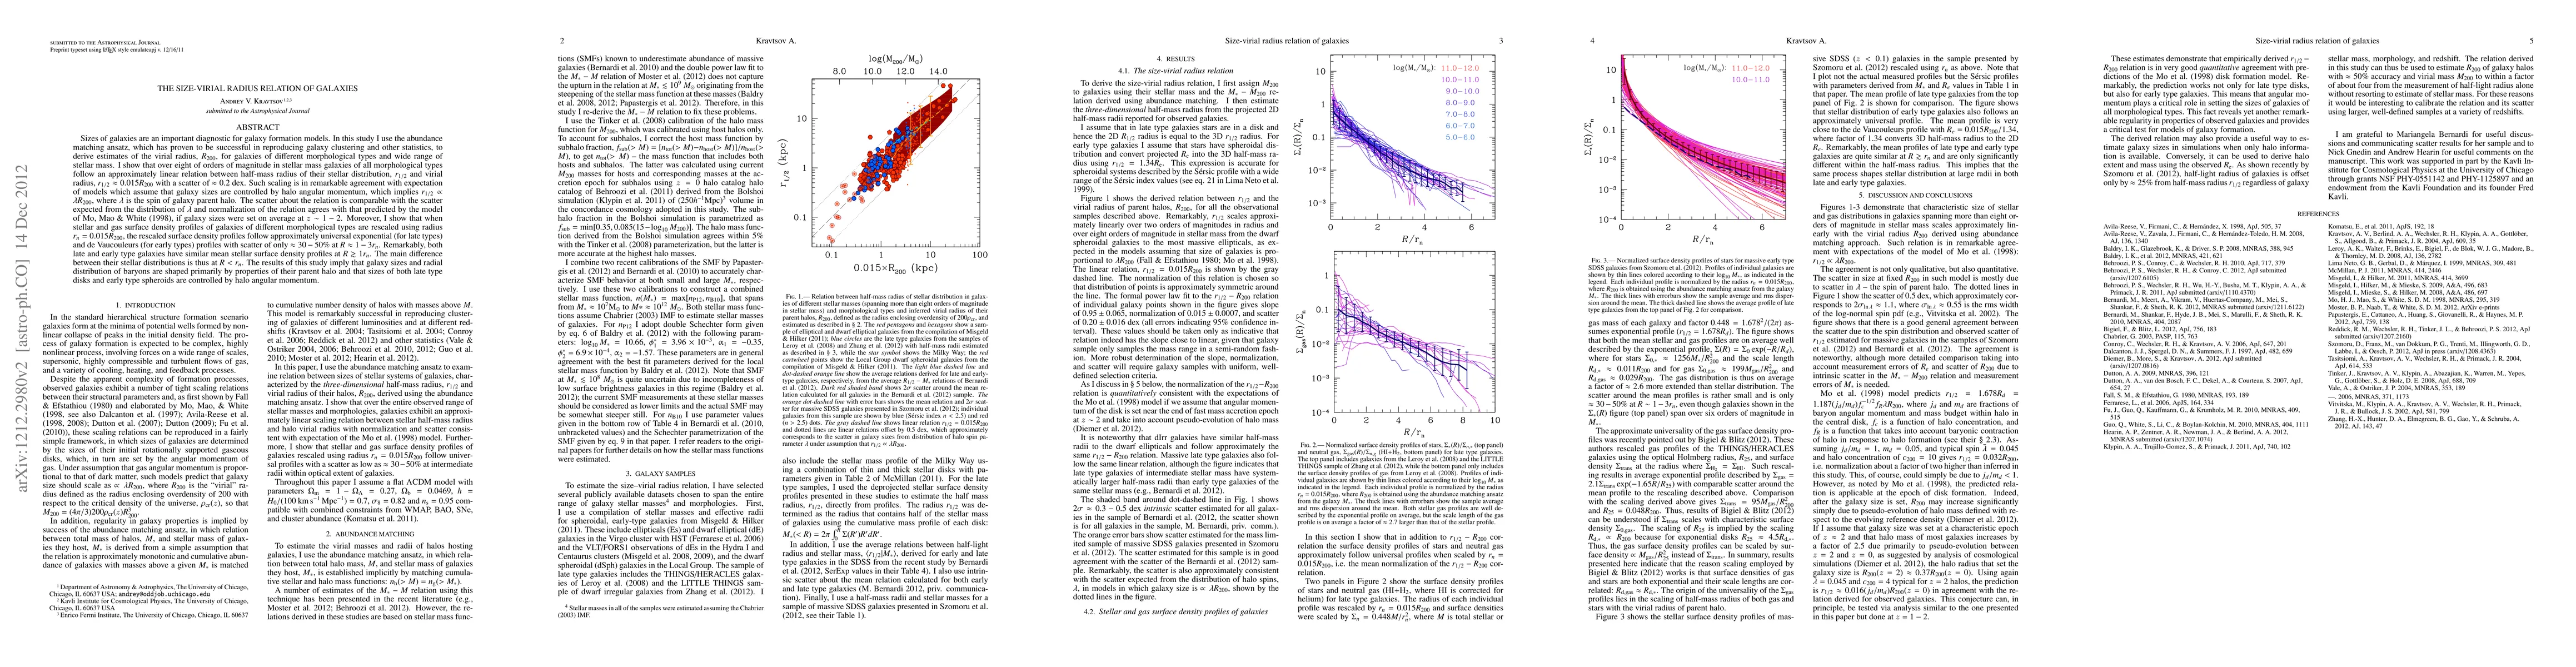
Sizes of galaxies are an important diagnostic for galaxy formation models. In this study I use the abundance matching ansatz, which has proven to be successful in reproducing galaxy clustering and other statistics, to derive estimates of the virial radius, R200, for galaxies of different morphological types and wide range of stellar mass. I show that over eight of orders of magnitude in stellar mass galaxies of all morphological types follow an approximately linear relation between 3D half-mass radius of their stellar distribution, rhalf and virial radius, rhalf~0.015R200 with a scatter of ~0.2 dex. Such scaling is in remarkable agreement with expectation of models which assume that galaxy sizes are controlled by halo angular momentum, which implies rhalf\propto lambda R200, where lambda is the spin of galaxy parent halo. The scatter about the relation is comparable with the scatter expected from the distribution of $\lambda$ and normalization of the relation agrees with that predicted by the model of Mo, Mao & White (1998), if galaxy sizes were set on average at z~1-2. Moreover, I show that when stellar and gas surface density profiles of galaxies of different morphological types are rescaled using radius r_n= 0.015 R200, the rescaled surface density profiles follow approximately universal exponential (for late types) and de Vaucouleurs (for early types) profiles with scatter of only 30-50% at R~1-3r_n. Remarkably, both late and early type galaxies have similar mean stellar surface density profiles at R>r_n. The main difference between their stellar distributions is thus at R
AI Key Findings
Get AI-generated insights about this paper's methodology, results, significance, and more — seven facets brought into focus.
Impact
Paper Details
PDF Preview
Key Terms
Citation Network
Current paper (gray), citations (green), references (blue)
Display is limited for performance on very large graphs.
Discussion 0