Authors
Summary
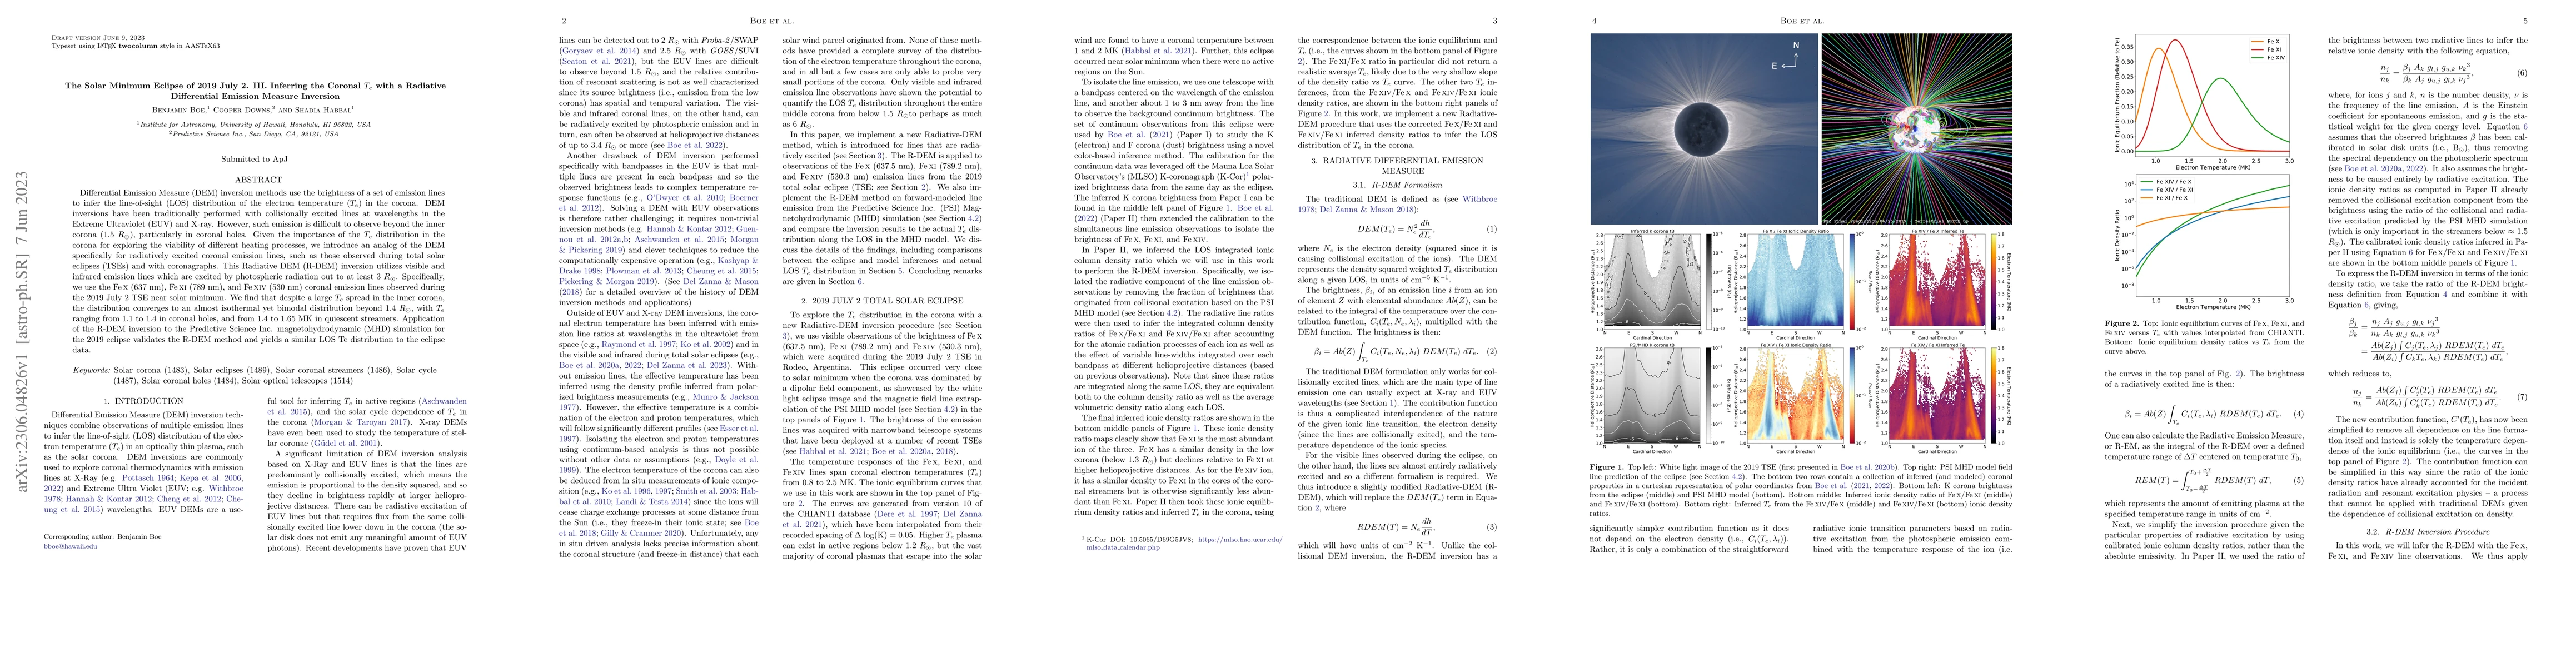
Differential Emission Measure (DEM) inversion methods use the brightness of a set of emission lines to infer the line-of-sight (LOS) distribution of the electron temperature ($T_e$) in the corona. DEM inversions have been traditionally performed with collisionally excited lines at wavelengths in the Extreme Ultraviolet (EUV) and X-ray. However, such emission is difficult to observe beyond the inner corona (1.5 R$_\odot$), particularly in coronal holes. Given the importance of the $T_e$ distribution in the corona for exploring the viability of different heating processes, we introduce an analog of the DEM specifically for radiatively excited coronal emission lines, such as those observed during total solar eclipses (TSEs) and with coronagraphs. This Radiative DEM (R-DEM) inversion utilizes visible and infrared emission lines which are excited by photospheric radiation out to at least 3 R$_\odot$. Specifically, we use the Fe X (637 nm), Fe XI (789 nm), and Fe XIV (530 nm) coronal emission lines observed during the 2019 July 2 TSE near solar minimum. We find that despite a large $T_e$ spread in the inner corona, the distribution converges to an almost isothermal yet bimodal distribution beyond 1.4 R$_\odot$, with $T_e$ ranging from 1.1 to 1.4 in coronal holes, and from 1.4 to 1.65 MK in quiescent streamers. Application of the R-DEM inversion to the Predictive Science Inc. magnetohydrodynamic (MHD) simulation for the 2019 eclipse validates the R-DEM method and yields a similar LOS Te distribution to the eclipse data.
AI Key Findings
Get AI-generated insights about this paper's methodology, results, and significance.
Paper Details
PDF Preview
Key Terms
Citation Network
Current paper (gray), citations (green), references (blue)
Display is limited for performance on very large graphs.
Similar Papers
Found 4 papersThe Solar Minimum Eclipse of 2019 July 2: II. The First Absolute Brightness Measurements and MHD Model Predictions of Fe X, XI and XIV out to 3.4 Rs
Benjamin Boe, Cooper Downs, Shadia Habbal et al.
New Observations of the IR Emission Corona from the July 2, 2019 Eclipse Flight of the Airborne Infrared Spectrometer
Peter Cheimets, Leon Golub, Edward E. DeLuca et al.
| Title | Authors | Year | Actions |
|---|
Comments (0)