Publication
Metrics
AI Quick Summary
This paper compares high-energy X-ray source number counts from Swift/BAT and NuSTAR missions, finding that while Swift/BAT counts follow a Euclidean slope, NuSTAR counts show a steeper slope due to an upturn at lower fluxes, suggesting discrepancies likely due to faint NuSTAR sources.
Paper Preview
Abstract
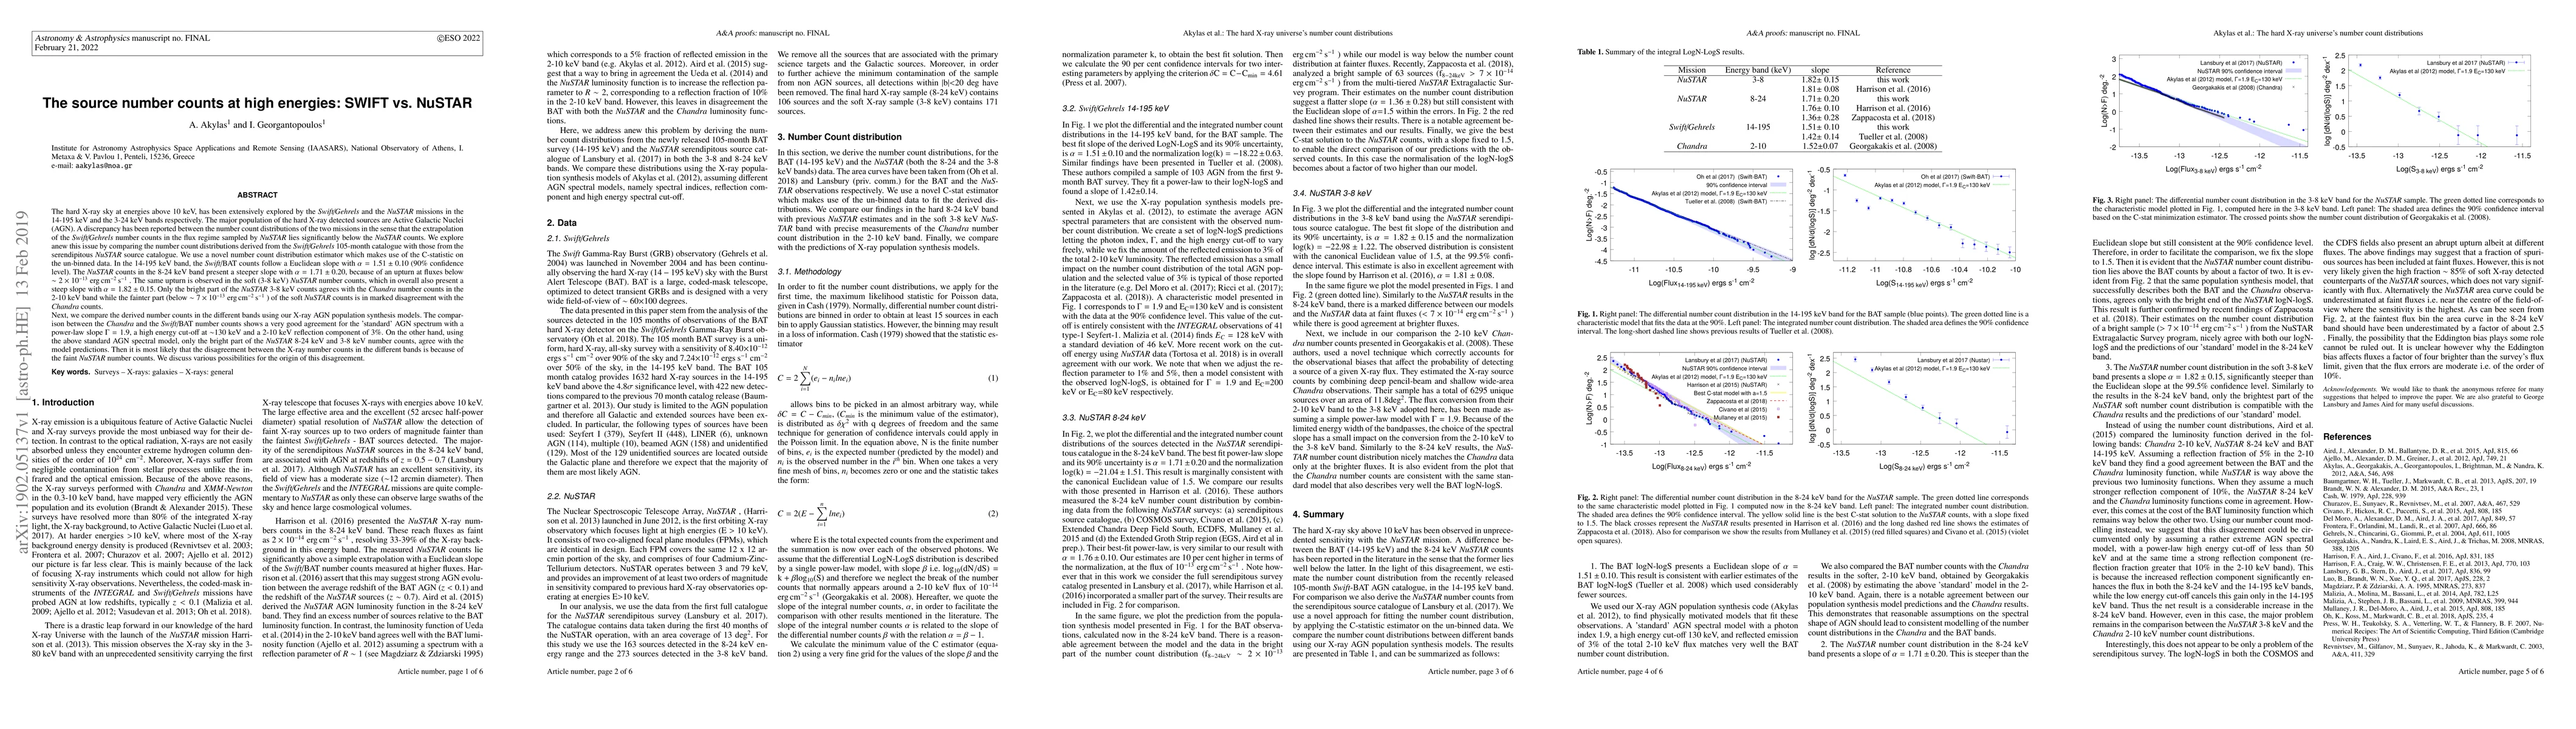
The hard X-ray sky at energies above 10 keV, has been extensively explored by the Swift and the NuSTAR missions in the 14-195 keV and the 3-24 keV bands respectively. The major population of the hard X-ray detected sources are AGN. We compare the number count distributions derived from the swift 105-month catalogue with those from the serendipitous NuSTAR source catalogue. In the 14-195 keV band, the Swift/BAT counts follow a Euclidean slope with alpha=1.51+/-0.10 (90% confidence level). The NuSTAR counts in the 8-24 keV band present a steeper slope with alpha = 1.71+/- 0.2$, because of an upturn at fluxes below ~2x10^{-13} erg/cm2/s. The same upturn is observed in the soft (3-8 keV) NuSTAR number counts, which in overall also present a steep slope with alpha = 1.82+/- 0.15. Only the bright part of the NuSTAR 3-8 keV counts agrees with the chandra number counts in the 2-10 keV band while the fainter part (<7x10^{-13} erg/cm2/s ) of the soft NuSTAR counts is in marked disagreement with the chandra counts. Next, we compare the derived number counts in the different bands using our X-ray AGN population synthesis models. The comparison between the Chandra and the Swift/BAT number counts shows a very good agreement for the 'standard' AGN spectrum with a power-law slope Gamma=1.9, a high energy cut-off at ~130 keV and a 2-10 keV reflection component of 3%. On the other hand, using the above standard AGN spectral model, only the bright part of the NuSTAR 8-24 keV and 3-8 keV number counts, agree with the model predictions. Then it is most likely that the disagreement between the X-ray number counts in the different bands is because of the faint NuSTAR number counts. We discuss various possibilities for the origin of this disagreement.
AI Key Findings
Get AI-generated insights about this paper's methodology, results, significance, and more — seven facets brought into focus.
Impact
Paper Details
PDF Preview
Key Terms
Citation Network
Current paper (gray), citations (green), references (blue)
Display is limited for performance on very large graphs.
Discussion 0