Publication
Metrics
AI Quick Summary
This study investigates the [CII] "line cooling deficit" in galaxies, revealing a correlation between the [CII]/TIR ratio and the surface density of 24µm emission, with higher metallicity deepening the deficit. The star formation rate density drives a continuous trend in deepening [CII] deficit across various galaxy types, suggesting a direct estimation of star formation rate from [CII]/TIR measurements.
Paper Preview
Abstract
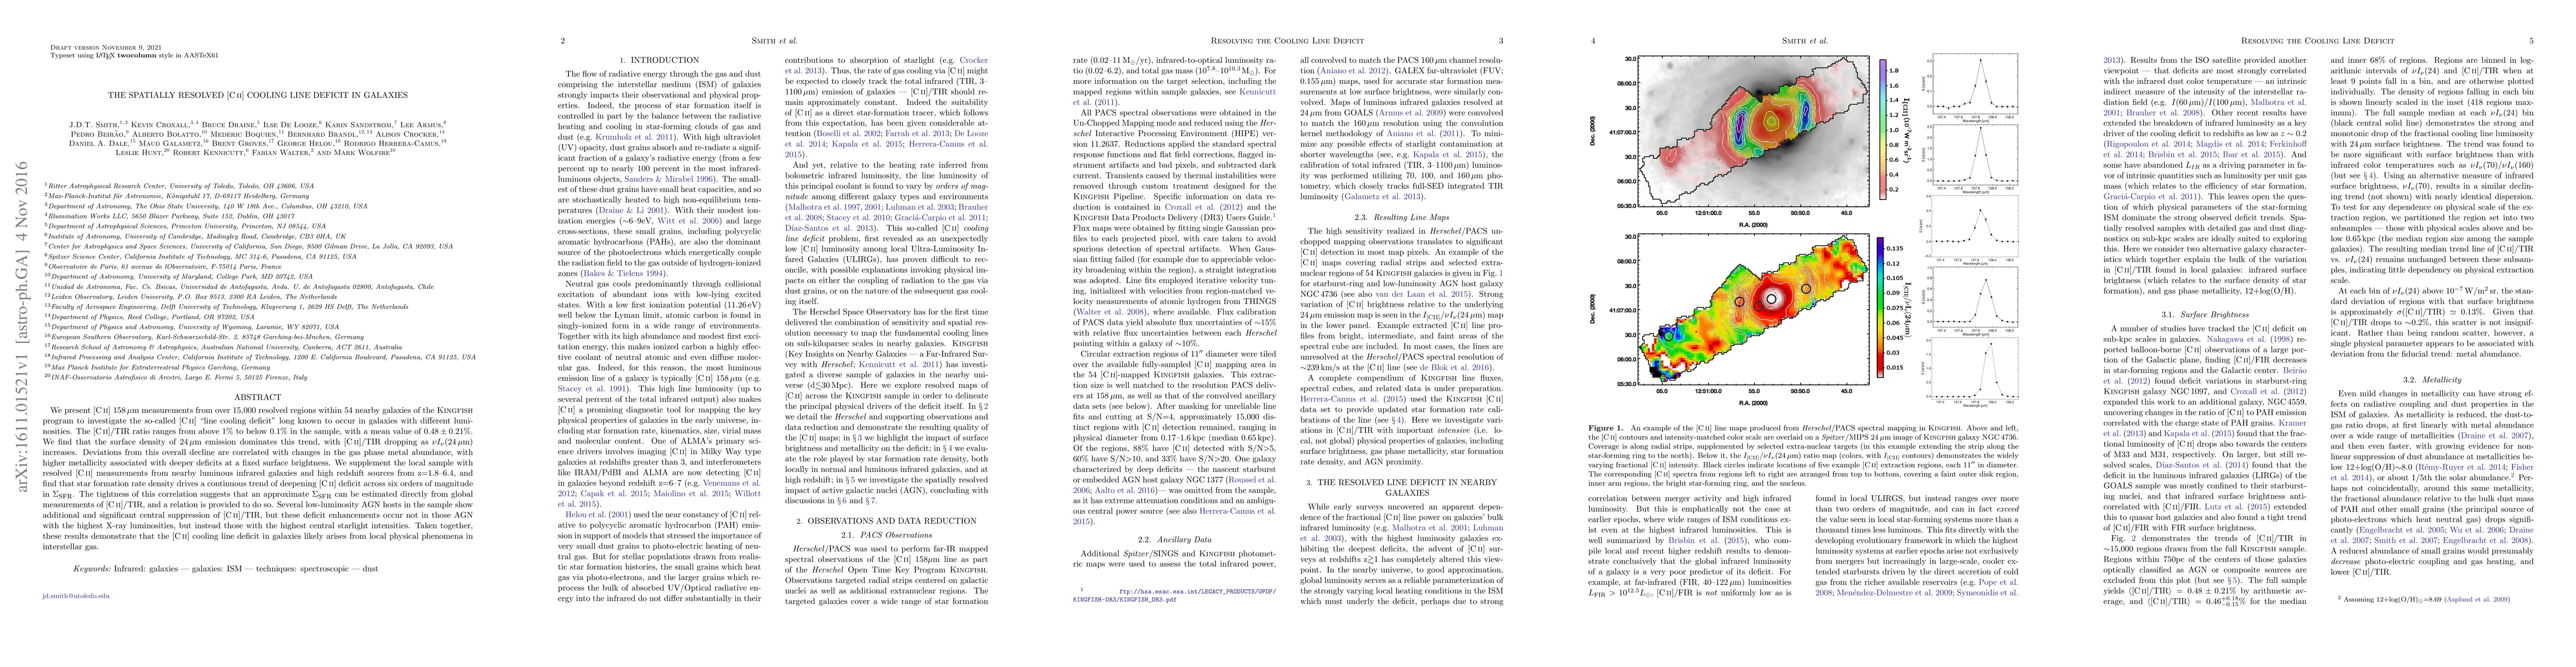
We present [CII] 158um measurements from over 15,000 resolved regions within 54 nearby galaxies of the KINGFISH program to investigate the so-called [CII] "line cooling deficit" long known to occur in galaxies with different luminosities. The [CII]/TIR ratio ranges from above 1% to below 0.1% in the sample, with a mean value of 0.48+-0.21%. We find that the surface density of 24um emission dominates this trend, with [CII]/TIR dropping as nuInu{24um} increases. Deviations from this overall decline are correlated with changes in the gas phase metal abundance, with higher metallicity associated with deeper deficits at a fixed surface brightness. We supplement the local sample with resolved [CII] measurements from nearby luminous infrared galaxies and high redshift sources from z=1.8-6.4, and find that star formation rate density drives a continuous trend of deepening [CII] deficit across six orders of magnitude in SFRD. The tightness of this correlation suggests that an approximate star formation rate density can be estimated directly from global measurements of [CII]/TIR, and a relation is provided to do so. Several low-luminosity AGN hosts in the sample show additional and significant central suppression of [CII]/TIR, but these deficit enhancements occur not in those AGN with the highest X-ray luminosities, but instead those with the highest central starlight intensities. Taken together, these results demonstrate that the [CII] cooling line deficit in galaxies likely arises from local physical phenomena in interstellar gas.
AI Key Findings
Get AI-generated insights about this paper's methodology, results, significance, and more — seven facets brought into focus.
Impact
Paper Details
PDF Preview
Key Terms
Citation Network
Current paper (gray), citations (green), references (blue)
Display is limited for performance on very large graphs.
Discussion 0