Summary
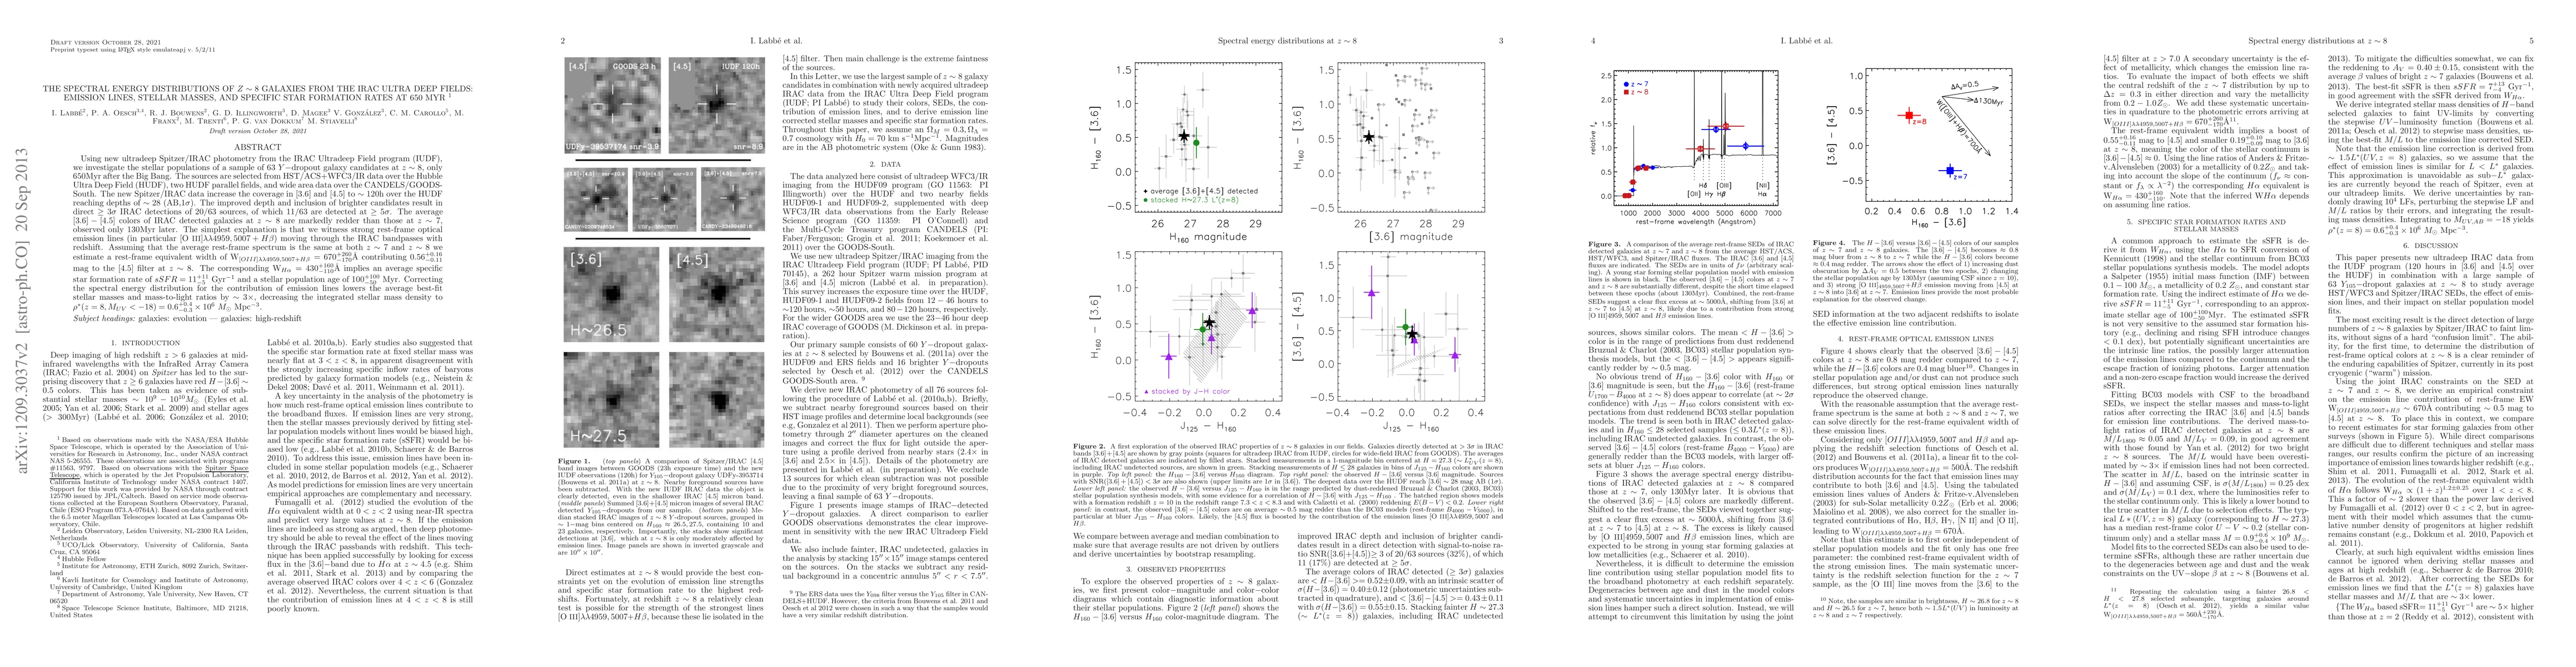
Using new ultradeep Spitzer/IRAC photometry from the IRAC Ultradeep Field program (IUDF), we investigate the stellar populations of a sample of 63 Y-dropout galaxy candidates at z~8, only 650Myr after the Big Bang. The sources are selected from HST/ACS+WFC3/IR data over the Hubble Ultra Deep Field (HUDF), two HUDF parallel fields, and wide area data over the CANDELS/GOODS-South. The new Spitzer/IRAC data increase the coverage at 3.6 micron and 4.5 micron to ~120h over the HUDF reaching depths of ~28 (AB,1 sigma). The improved depth and inclusion of brighter candidates result in direct >3 sigma IRAC detections of 20/63 sources, of which 11/63 are detected at > 5 sigma. The average [3.6]-[4.5] colors of IRAC detected galaxies at z~8 are markedly redder than those at z~7, observed only 130Myr later. The simplest explanation is that we witness strong rest-frame optical emission lines (in particular [OIII]4959,5007+Hbeta) moving through the IRAC bandpasses with redshift. Assuming that the average rest-frame spectrum is the same at both z~7 and z~8 we estimate a rest-frame equivalent width of W([OIII]4959,5007+Hbeta) = 670 (+260,-170) Angstrom contributing 0.56 (+0.16,-0.11) mag to the 4.5 micron filter at z~8. The corresponding W(Halpha) = 430 (+160,-110) Angstrom implies an average specific star formation rate of sSFR = 11 (+11,-5) Gyr^-1 and a stellar population age of 100 (+100,-50) Myr. Correcting the spectral energy distribution for the contribution of emission lines lowers the average best-fit stellar masses and mass-to-light ratios by x3, decreasing the integrated stellar mass density to rho*(z=8,MUV<-18)=0.6 (+0.4,-0.3) x 10^6 Msun Mpc^-3.
AI Key Findings
Get AI-generated insights about this paper's methodology, results, and significance.
Paper Details
PDF Preview
Key Terms
Citation Network
Current paper (gray), citations (green), references (blue)
Display is limited for performance on very large graphs.
| Title | Authors | Year | Actions |
|---|
Comments (0)