Summary
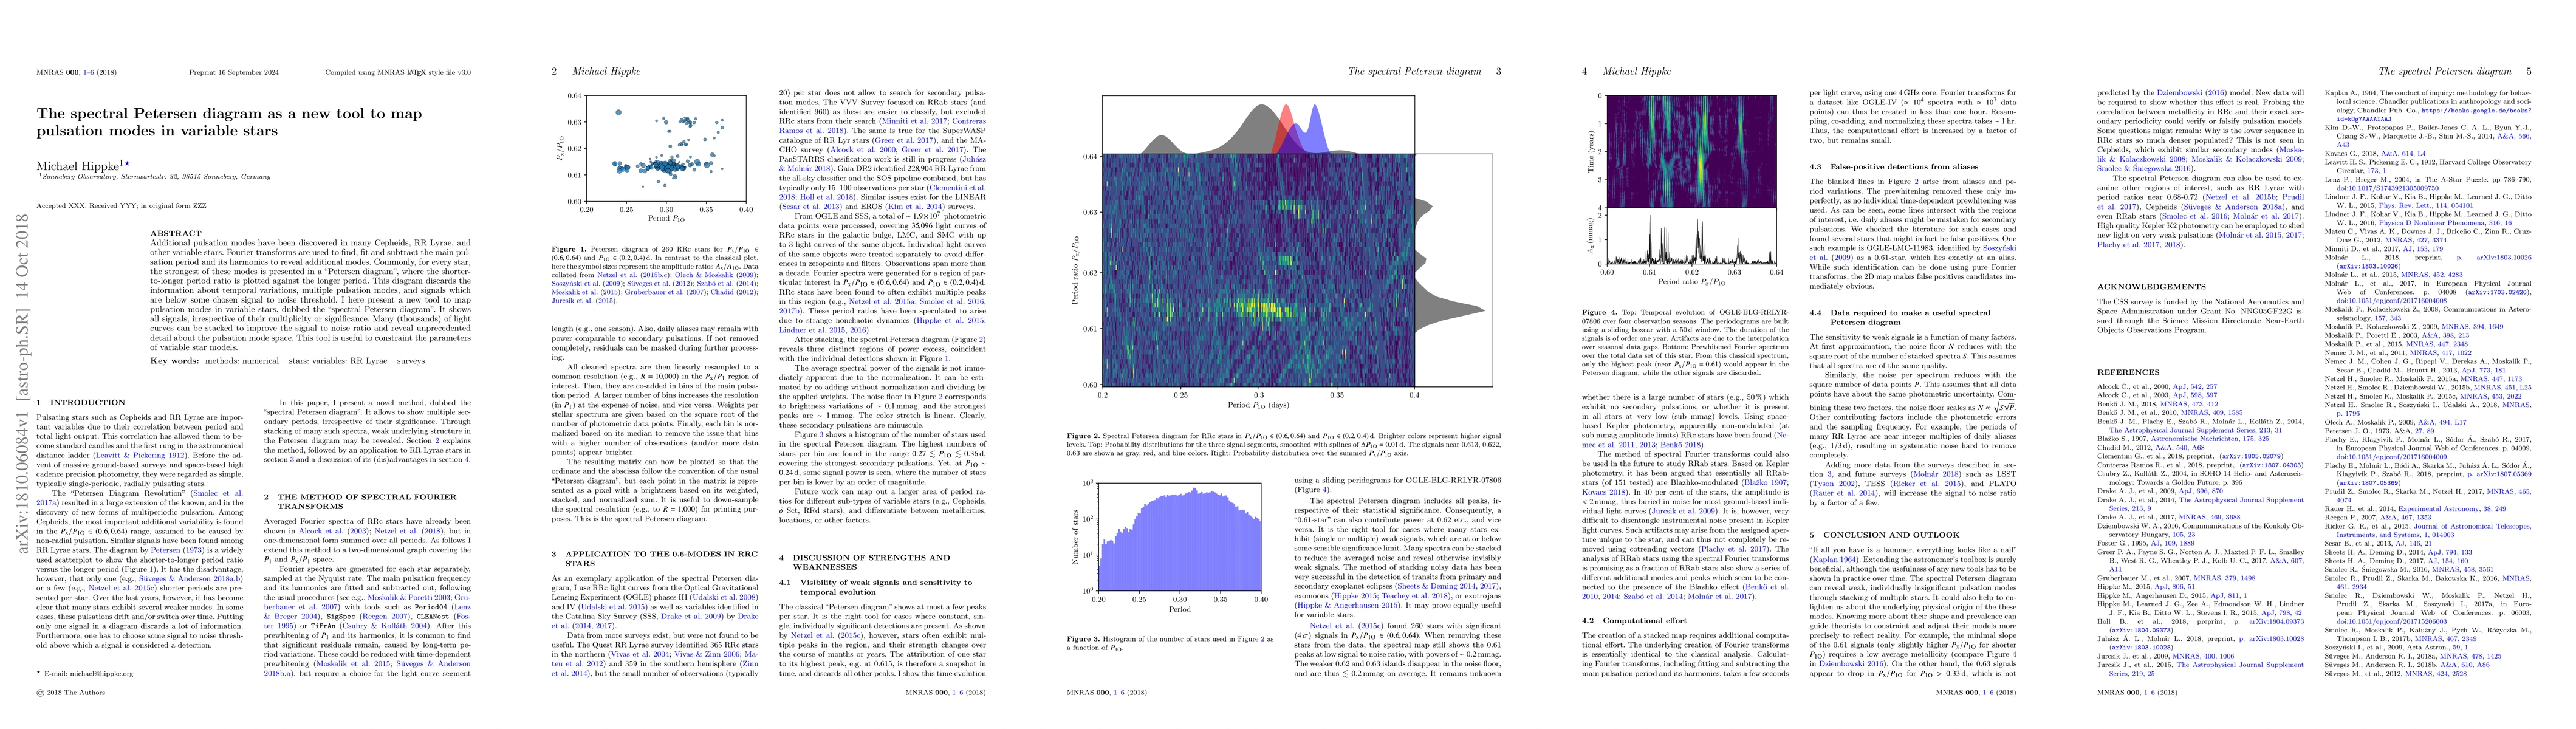
Additional pulsation modes have been discovered in many Cepheids, RR Lyrae, and other variable stars. Fourier transforms are used to find, fit and subtract the main pulsation period and its harmonics to reveal additional modes. Commonly, for every star, the strongest of these modes is presented in a "Petersen diagram", where the shorter-to-longer period ratio is plotted against the longer period. This diagram discards the information about temporal variations, multiple pulsation modes, and signals which are below some chosen signal to noise threshold. I here present a new tool to map pulsation modes in variable stars, dubbed the "spectral Petersen diagram". It shows all signals, irrespective of their multiplicity or significance. Many (thousands) of light curves can be stacked to improve the signal to noise ratio and reveal unprecedented detail about the pulsation mode space. This tool is useful to constraint the parameters of variable star models.
AI Key Findings
Get AI-generated insights about this paper's methodology, results, and significance.
Paper Details
PDF Preview
Key Terms
Citation Network
Current paper (gray), citations (green), references (blue)
Display is limited for performance on very large graphs.
Similar Papers
Found 4 papersNo citations found for this paper.
Comments (0)