The "SPectrogram Analysis and Cataloguing Environment" (SPACE) Labelling Tool
Publication
Metrics
AI Quick Summary
The SPectrogram Analysis and Cataloguing Environment (SPACE) is an interactive Python tool for labeling radio emission features in dynamic spectra. It allows users to draw polygons on spectra, saving feature names and coordinates in a '.json' file following the TFCat format.
Paper Preview
Abstract
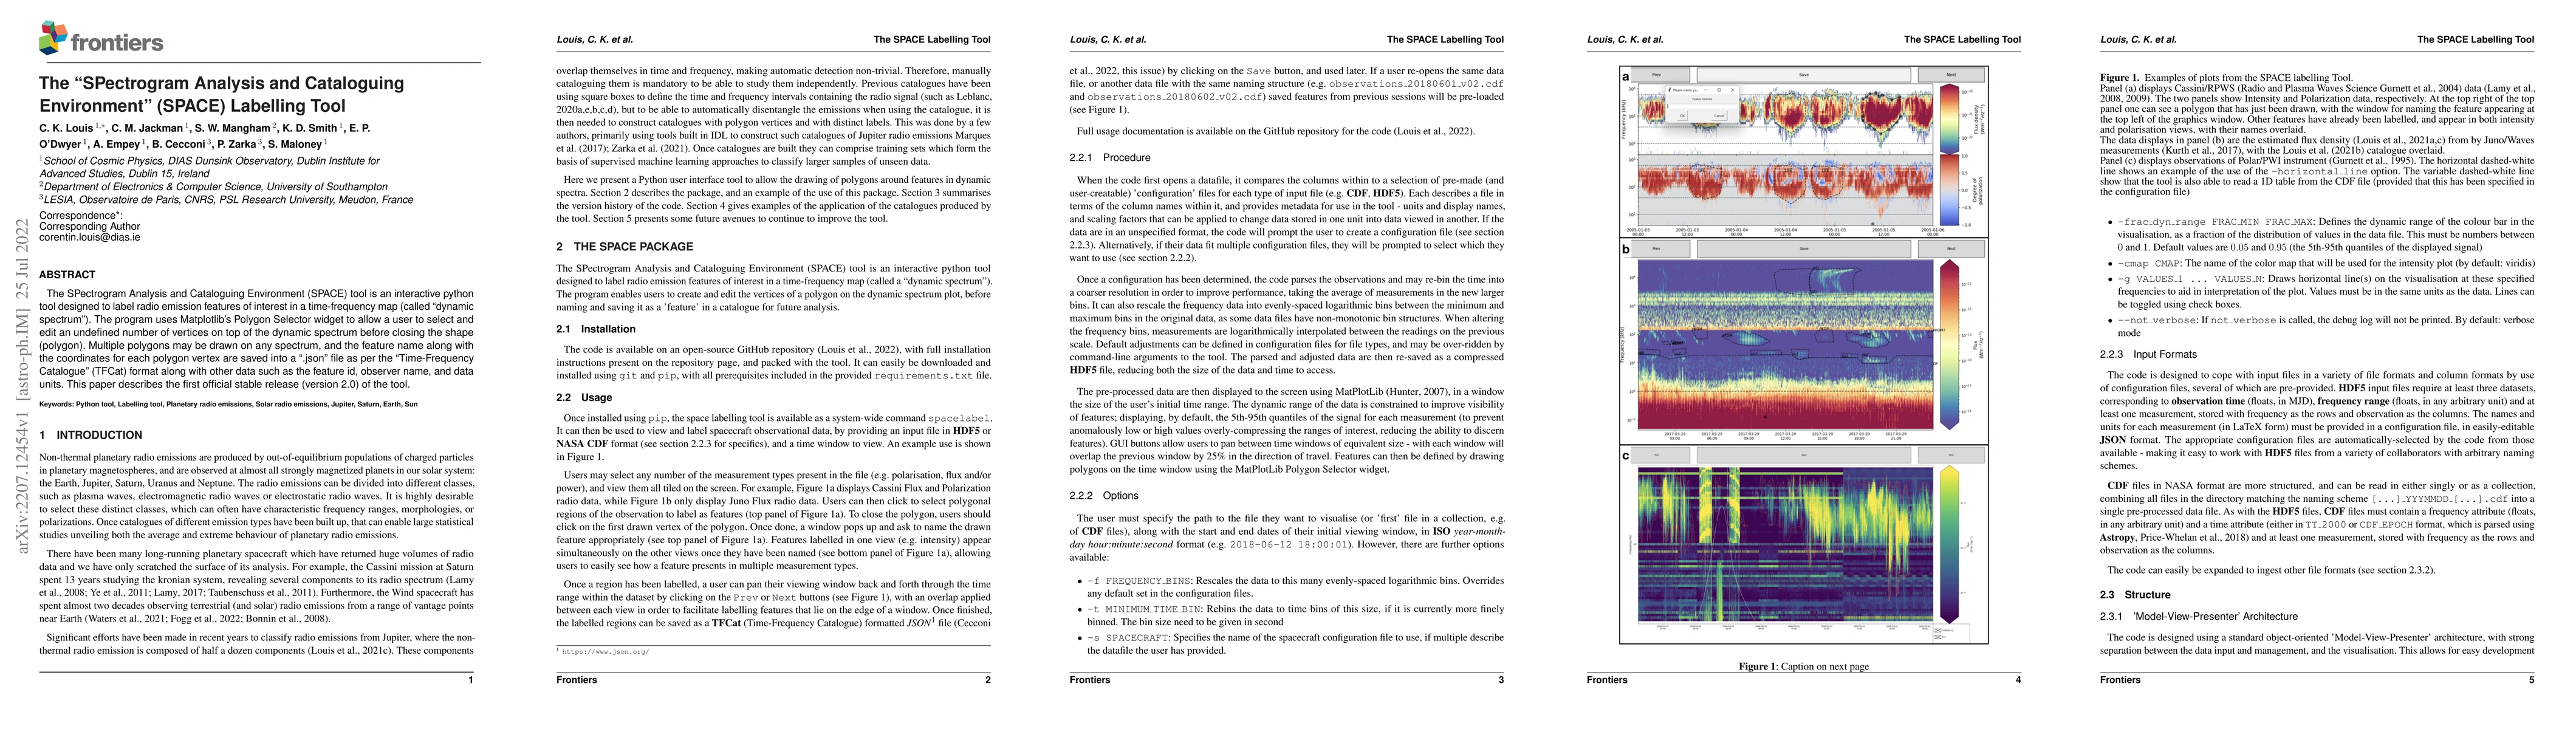
The SPectrogram Analysis and Cataloguing Environment (SPACE) tool is an interactive python tool designed to label radio emission features of interest in a time-frequency map (called 'dynamic spectrum'). The program uses Matplotlib's Polygon Selector widget to allow a user to select and edit an undefined number of vertices on top of the dynamic spectrum before closing the shape (polygon). Multiple polygons may be drawn on any spectrum, and the feature name along with the coordinates for each polygon vertex are saved into a '.json' file as per the 'Time-Frequency Catalogue' (TFCat) format along with other data such as the feature id, observer name, and data units. This paper describes the first official stable release (version 2.0) of the tool.
AI Key Findings
Get AI-generated insights about this paper's methodology, results, significance, and more — seven facets brought into focus.
Impact
Paper Details
Authors
PDF Preview
Key Terms
Citation Network
Current paper (gray), citations (green), references (blue)
Display is limited for performance on very large graphs.
Discussion 0