Summary
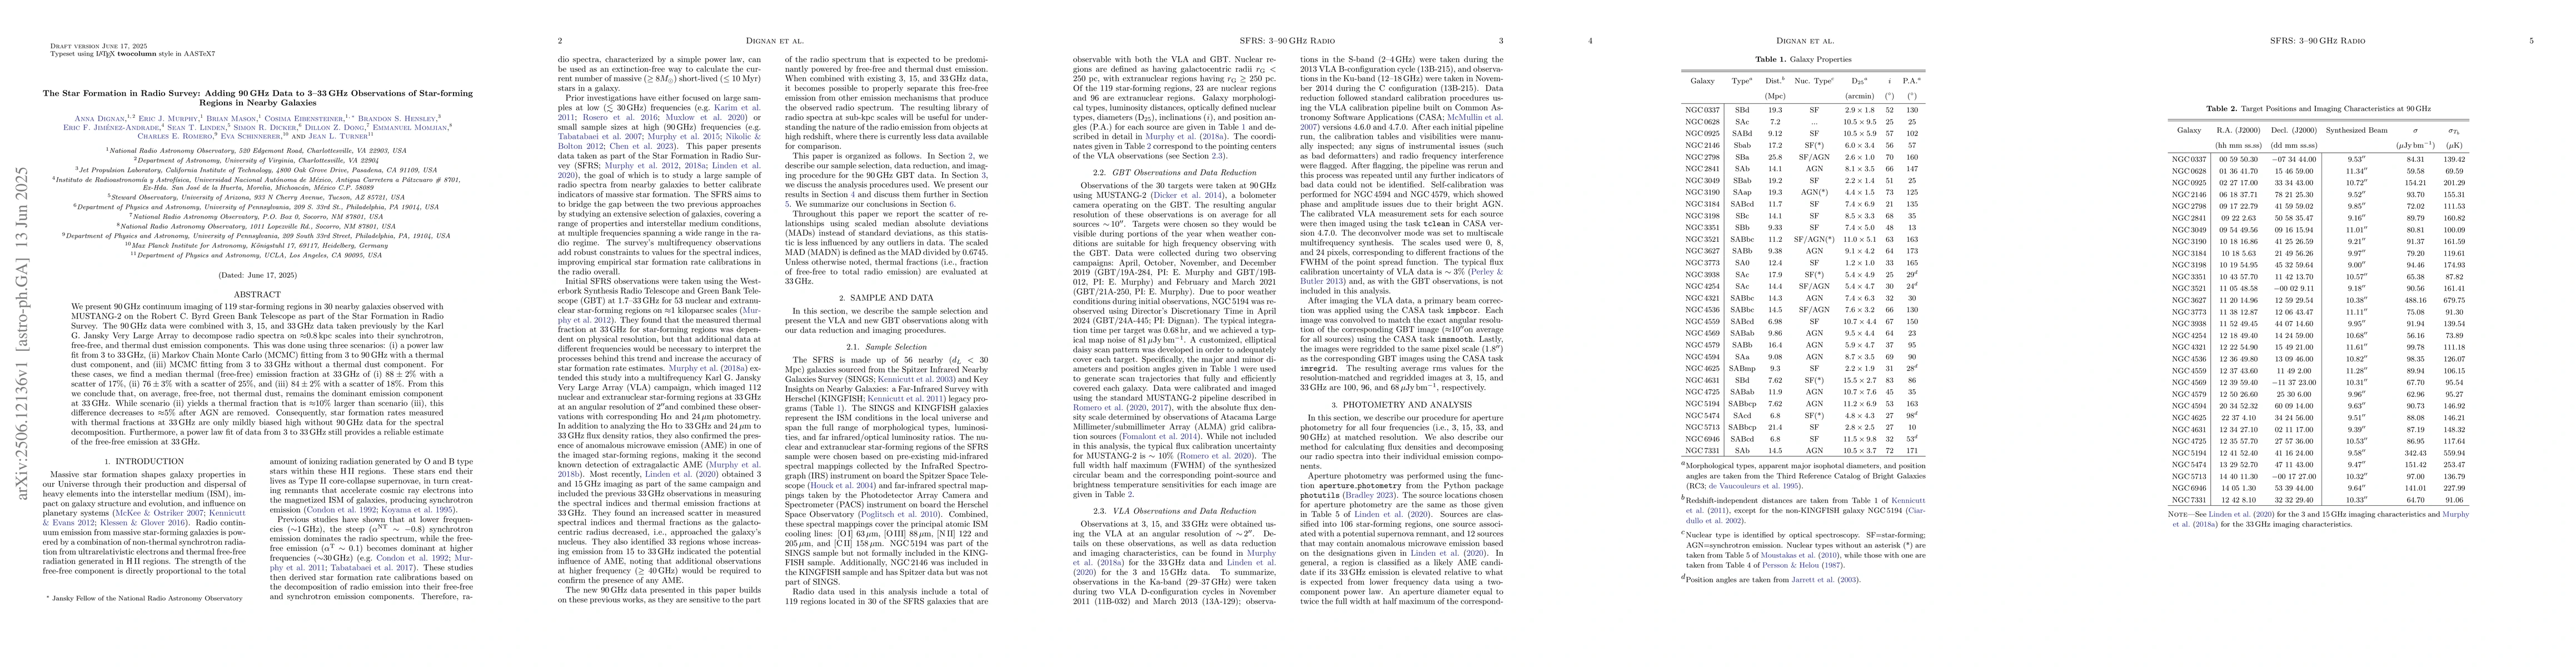
We present 90 GHz continuum imaging of 119 star-forming regions in 30 nearby galaxies observed with MUSTANG-2 on the Robert C. Byrd Green Bank Telescope as part of the Star Formation in Radio Survey. The 90 GHz data were combined with 3, 15, and 33 GHz data taken previously by the Karl G. Jansky Very Large Array to decompose radio spectra on $\approx$0.8 kpc scales into their synchrotron, free-free, and thermal dust emission components. This was done using three scenarios: (i) a power law fit from 3 to 33 GHz, (ii) Markov Chain Monte Carlo (MCMC) fitting from 3 to 90 GHz with a thermal dust component, and (iii) MCMC fitting from 3 to 33 GHz without a thermal dust component. For these cases, we find a median thermal (free-free) emission fraction at 33 GHz of (i) $88 \pm 2$% with a scatter of 17%, (ii) $76\pm 3$% with a scatter of 25%, and (iii) $84\pm 2$% with a scatter of 18%. From this we conclude that, on average, free-free, not thermal dust, remains the dominant emission component at 33 GHz. While scenario (ii) yields a thermal fraction that is $\approx$10% larger than scenario (iii), this difference decreases to $\approx$5% after AGN are removed. Consequently, star formation rates measured with thermal fractions at 33 GHz are only mildly biased high without 90 GHz data for the spectral decomposition. Furthermore, a power law fit of data from 3 to 33 GHz still provides a reliable estimate of the free-free emission at 33 GHz.
AI Key Findings
Get AI-generated insights about this paper's methodology, results, and significance.
Paper Details
PDF Preview
Citation Network
Current paper (gray), citations (green), references (blue)
Display is limited for performance on very large graphs.
Similar Papers
Found 4 papersNo citations found for this paper.
Comments (0)