Publication
Metrics
AI Quick Summary
This article explores the statistical methods for measuring the power spectrum of red noise processes using multiple instruments, particularly in radio astronomy. It compares two estimators: the spectrum average and the cross-spectrum, showing that the latter, when applied to two instruments, follows a Variance-Gamma distribution, and generalizes this approach to $q$ devices.
Paper Preview
Abstract
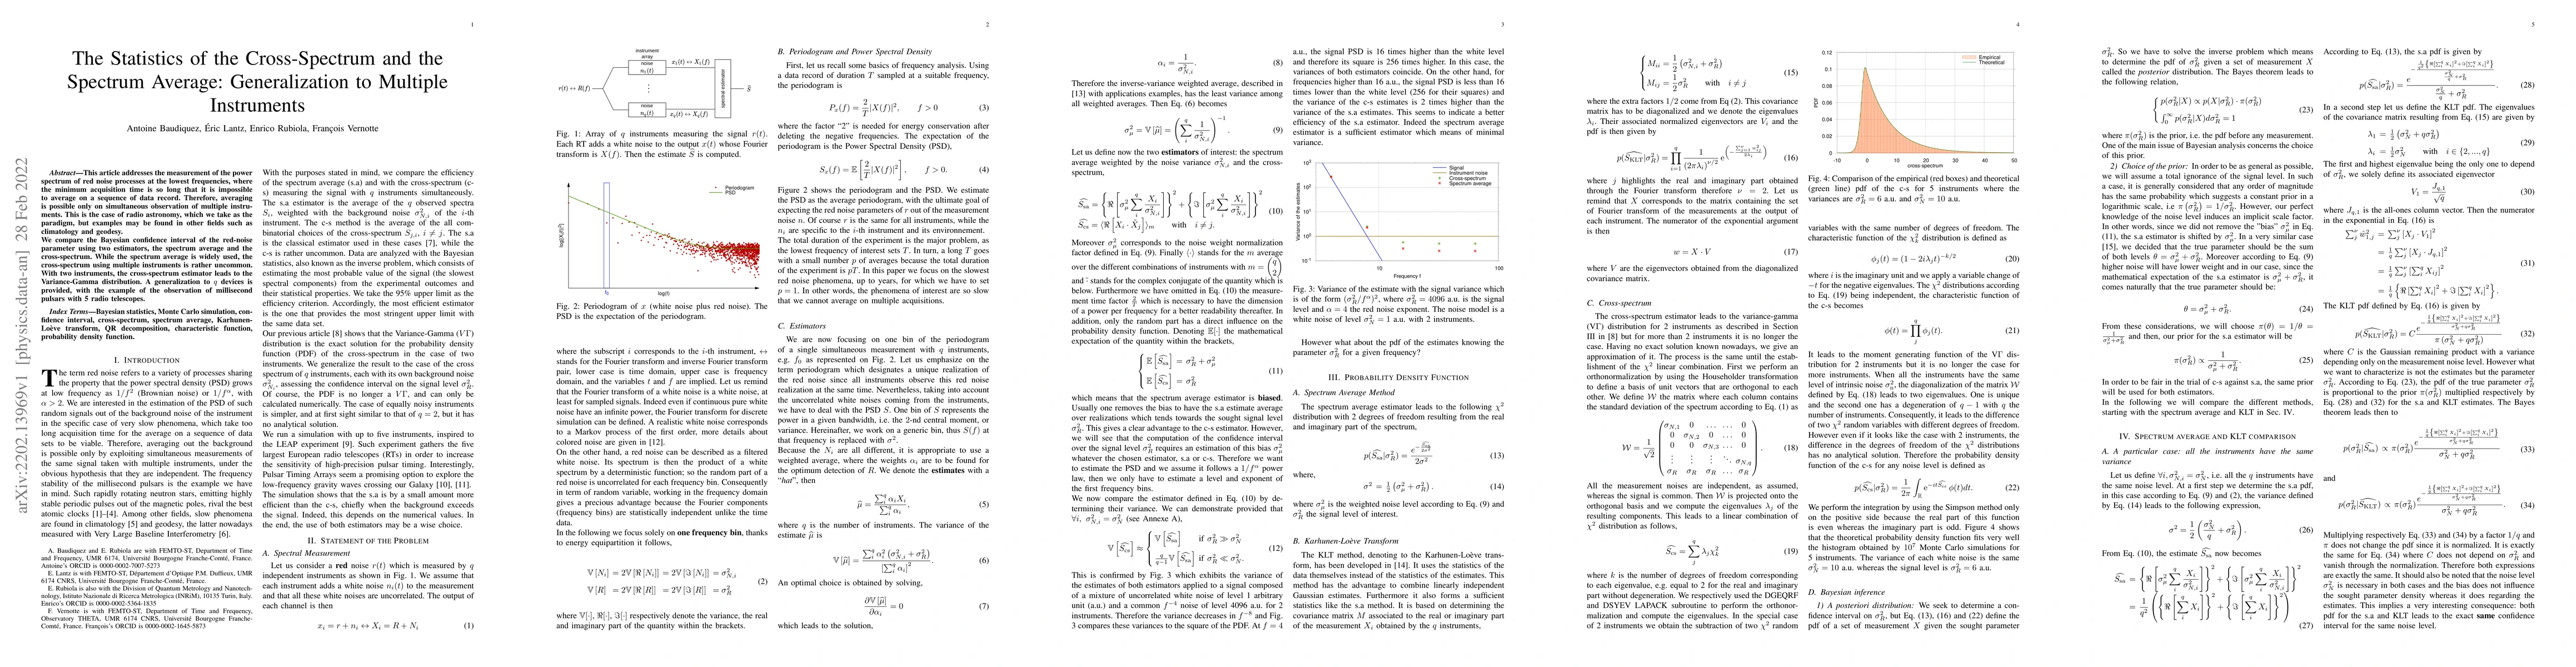
This article addresses the measurement of the power spectrum of red noise processes at the lowest frequencies, where the minimum acquisition time is so long that it is impossible to average on a sequence of data record. Therefore, averaging is possible only on simultaneous observation of multiple instruments. This is the case of radio astronomy, which we take as the paradigm, but examples may be found in other fields such as climatology and geodesy. We compare the Bayesian confidence interval of the red-noise parameter using two estimators, the spectrum average and the cross-spectrum. While the spectrum average is widely used, the cross-spectrum using multiple instruments is rather uncommon. With two instruments, the cross-spectrum estimator leads to the Variance-Gamma distribution. A generalization to $q$ devices is provided, with the example of the observation of millisecond pulsars with 5 radio telescopes.
AI Key Findings
Get AI-generated insights about this paper's methodology, results, significance, and more — seven facets brought into focus.
Impact
Paper Details
Authors
PDF Preview
Key Terms
Citation Network
Current paper (gray), citations (green), references (blue)
Display is limited for performance on very large graphs.
Discussion 0