The Support and Resistance Line Method: An Analysis via Optimal Stopping
Publication
Metrics
AI Quick Summary
This paper mathematically models the support and resistance line method in technical analysis, demonstrating that the value function is $C^1$ and solves a free boundary problem. It shows that optimal trading strategies can be derived from linked optimal stopping problems, and compares these strategies with standard rules to assess the method's effectiveness.
Paper Preview
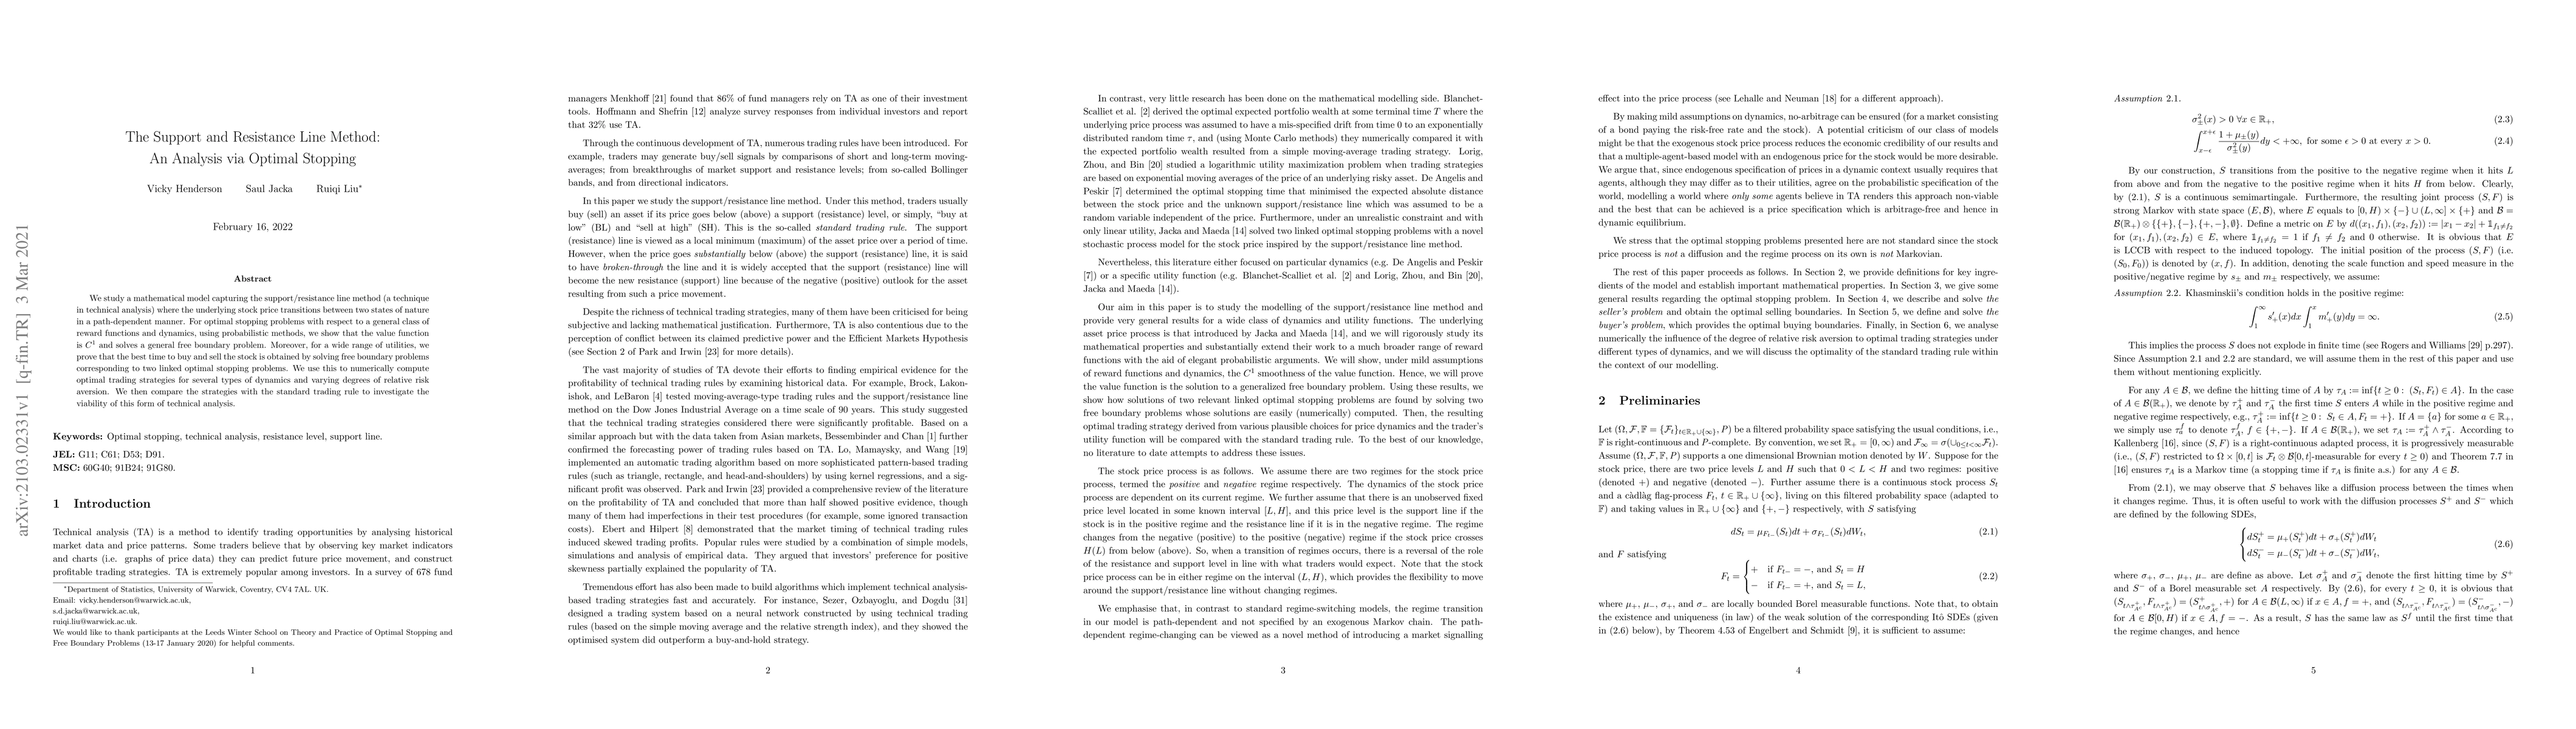
Abstract
We study a mathematical model capturing the support/resistance line method (a technique in technical analysis) where the underlying stock price transitions between two states of nature in a path-dependent manner. For optimal stopping problems with respect to a general class of reward functions and dynamics, using probabilistic methods, we show that the value function is $C^1$ and solves a general free boundary problem. Moreover, for a wide range of utilities, we prove that the best time to buy and sell the stock is obtained by solving free boundary problems corresponding to two linked optimal stopping problems. We use this to numerically compute optimal trading strategies for several types of dynamics and varying degrees of relative risk aversion. We then compare the strategies with the standard trading rule to investigate the viability of this form of technical analysis.
AI Key Findings
Get AI-generated insights about this paper's methodology, results, significance, and more — seven facets brought into focus.
Impact
Paper Details
Authors
PDF Preview
Key Terms
Citation Network
Current paper (gray), citations (green), references (blue)
Display is limited for performance on very large graphs.
Discussion 0