ArxivLens

Publication

Published: Aug 07, 2026
Categories: cs.PF, cs.CE

Metrics

Source: ArXiv

Quick Answers

What methodology did the authors use?

The TEI uses three direction-aware metrics (cache hit rate, cache amortization ratio, premium model share) normalized to a 0-100 scale, aggregated via equal weights plus a BoD DEA model with a robust order-m extension to handle sparse data. It provides organization-specific explanations and frontier-gap recommendations by benchmarking against peer subsets and generating simulated, anonymized usage data when real data are... More in Methodology →

What are the key results?

TEI condenses multi-dimensional token efficiency into a single interpretable score (0-100) with organization-specific explanations. — In a cohort of 39 organizations, the front-tier dominates TEI scores (36 above 90) while lower performers are clearly distinguished through percentile ranks. More in Key Results →

Why is this work significant?

TEI offers a transparent, interpretable framework for benchmarking AI token efficiency across organizations independent of provider, addressing the need for a standardized cost-efficiency metric in token-based AI usage. More in Significance →

What are the main limitations?

Current results rely on internal tool usage data; external usage data and per-request billing were not available, limiting external applicability. — Additive vs. geometric analyses are only implemented for the equal-weights baseline, not for endogenous BoD weights or robust order-m schemes. More in Limitations →

Paper Preview

Abstract

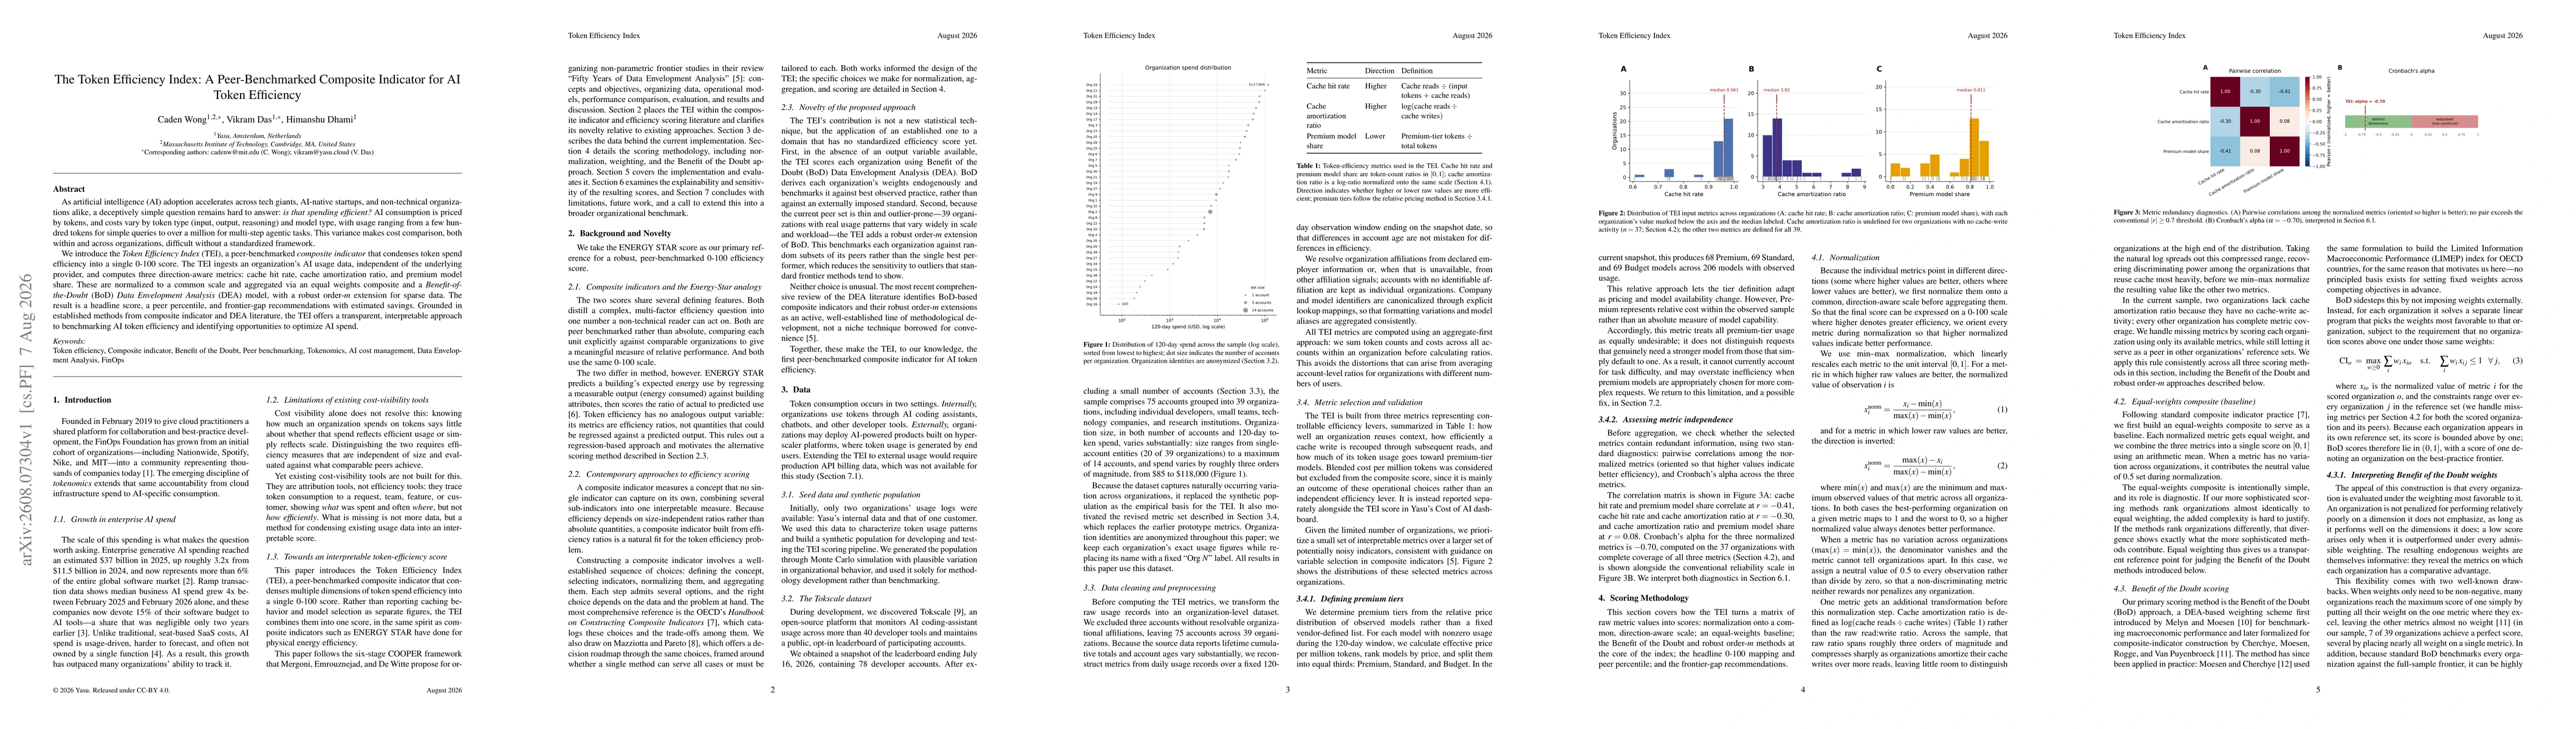
As artificial intelligence (AI) adoption accelerates across tech giants, AI-native startups, and non-technical organizations alike, a deceptively simple question remains hard to answer: is that spending efficient? AI consumption is priced by tokens, and costs vary by token type (input, output, reasoning) and model type, with usage ranging from a few hundred tokens for simple queries to over a million for multi-step agentic tasks. This variance makes cost comparison, both within and across organizations, difficult without a standardized framework. We introduce the Token Efficiency Index (TEI), a peer-benchmarked composite indicator that condenses token spend efficiency into a single 0-100 score. The TEI ingests an organization's AI usage data, independent of the underlying provider, and computes three direction-aware metrics: cache hit rate, cache amortization ratio, and premium model share. These are normalized to a common scale and aggregated via an equal weights composite and a Benefit-of-the-Doubt (BoD) Data Envelopment Analysis (DEA) model, with a robust order-m extension for sparse data. The result is a headline score, a peer percentile, and frontier-gap recommendations with estimated savings. Grounded in established methods from composite indicator and DEA literature, the TEI offers a transparent, interpretable approach to benchmarking AI token efficiency and identifying opportunities to optimize AI spend.
Key Findings, in focus

Seven facets of this paper, analysed and brought into focus by AI.

AI-generated · verify against source Generated Aug 11, 2026
In focus · one-line synthesis

TEI offers a transparent, interpretable framework for benchmarking AI token efficiency across organizations independent of provider, addressing the need for a standardized cost-efficiency metric in token-based AI usage.

01
MethodologyHow they did it

The TEI uses three direction-aware metrics (cache hit rate, cache amortization ratio, premium model share) normalized to a 0-100 scale, aggregated via equal weights plus a BoD DEA model with a robust order-m extension to handle sparse data. It provides organization-specific explanations and frontier-gap recommendations by benchmarking against peer subsets and generating simulated, anonymized usage data when real data are limited.

02
ResultsWhat they found
  • TEI condenses multi-dimensional token efficiency into a single interpretable score (0-100) with organization-specific explanations.
  • In a cohort of 39 organizations, the front-tier dominates TEI scores (36 above 90) while lower performers are clearly distinguished through percentile ranks.
  • Organizations receive actionable frontier-gap recommendations and directional cost-saving estimates based on metric gaps (e.g., cache hit rate, premium model share).
  • Robust order-m extension reduces sensitivity to outliers by benchmarking against repeated random peer subsets rather than a single best frontier.
  • BoD-based endogenous weighting permits individualized scoring without a fixed, universal weight set.
03
SignificanceWhy it matters

TEI offers a transparent, interpretable framework for benchmarking AI token efficiency across organizations independent of provider, addressing the need for a standardized cost-efficiency metric in token-based AI usage.

04
Technical ContributionsWhat's new technically

Introduction of a BoD Data Envelopment Analysis-based, peer-benchmarked composite indicator for AI token efficiency, combining three direction-aware metrics into a 0-100 score with robust order-m adjustments for sparse data and generating organization-specific explanations and improvement recommendations.

05
NoveltyWhat sets it apart

First peer-benchmarked composite indicator for AI token efficiency that uses BoD weights with a robust order-m extension, enabling organization-specific explanations and frontier-gap guidance in token-based AI spend benchmarking.

06
LimitationsWhat to be cautious about
  • Current results rely on internal tool usage data; external usage data and per-request billing were not available, limiting external applicability.
  • Additive vs. geometric analyses are only implemented for the equal-weights baseline, not for endogenous BoD weights or robust order-m schemes.
  • Peer percentiles are computed against the full sample due to missing cohort attributes, limiting cohort-specific benchmarking.
  • Premium-model share is treated uniformly without adjusting for task difficulty; misallocation of premium models is not yet quantitatively corrected.
  • Savings estimates are directional and qualitative for one metric (cache amortization ratio) and lack precise dollar estimates across all metrics.
07
Future WorkWhere it goes next
  • Extend additive vs. geometric comparisons to BoD and robust order-m endogenous weightings.
  • Incorporate per-request complexity signals to replace or augment premium-model share with a misallocation rate metric.
  • Develop per-request difficulty/quality signals to more accurately quantify potential savings.
  • Broaden benchmarking to include organization-wide usage, negotiated pricing, and value creation for AI systems.
  • Pilot TEI with external usage data and production API billing to enable external-facing applicability.

Paper Details

Paper ID: 2608.07304
Comments: 11 pages, 6 figures
Categories:
cs.PF cs.CE

How to Cite This Paper

Reference manager: RIS EndNote

Related Papers

4 found


Discussion 0

This website uses cookies to ensure you get the best experience. Learn more