The Trade-offs with Space Time Cube Representation of Spatiotemporal Patterns
Publication
Metrics
AI Quick Summary
This study investigates the trade-offs of space time cube representation in analyzing spatiotemporal patterns, finding that while it improves response times for complex questions, it can lead to higher error rates for simpler questions compared to a 2D baseline. The results suggest space time cubes are beneficial for understanding overall spatiotemporal structures.
Paper Preview
Abstract
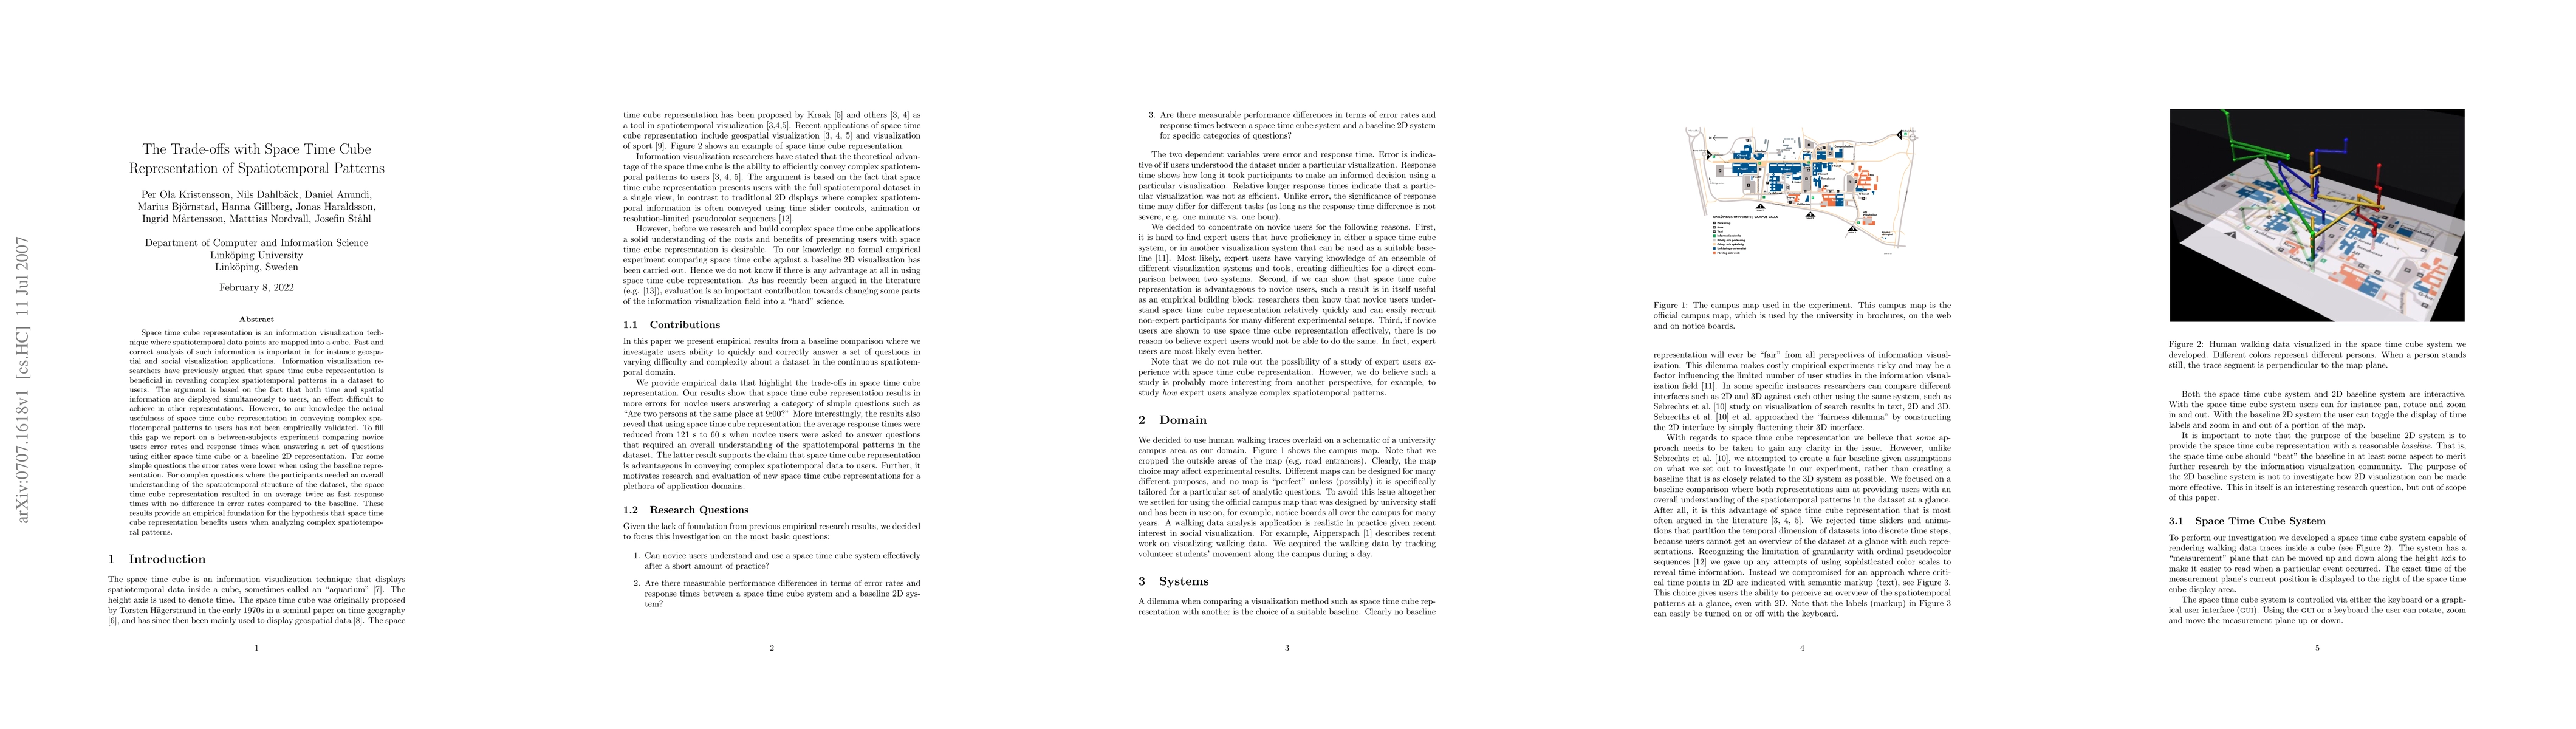
Space time cube representation is an information visualization technique where spatiotemporal data points are mapped into a cube. Fast and correct analysis of such information is important in for instance geospatial and social visualization applications. Information visualization researchers have previously argued that space time cube representation is beneficial in revealing complex spatiotemporal patterns in a dataset to users. The argument is based on the fact that both time and spatial information are displayed simultaneously to users, an effect difficult to achieve in other representations. However, to our knowledge the actual usefulness of space time cube representation in conveying complex spatiotemporal patterns to users has not been empirically validated. To fill this gap we report on a between-subjects experiment comparing novice users error rates and response times when answering a set of questions using either space time cube or a baseline 2D representation. For some simple questions the error rates were lower when using the baseline representation. For complex questions where the participants needed an overall understanding of the spatiotemporal structure of the dataset, the space time cube representation resulted in on average twice as fast response times with no difference in error rates compared to the baseline. These results provide an empirical foundation for the hypothesis that space time cube representation benefits users when analyzing complex spatiotemporal patterns.
AI Key Findings
Get AI-generated insights about this paper's methodology, results, significance, and more — seven facets brought into focus.
Impact
PDF Preview
Key Terms
Citation Network
Current paper (gray), citations (green), references (blue)
Display is limited for performance on very large graphs.
Discussion 0