The Turtleback Diagram for Conditional Probability
Publication
Metrics
AI Quick Summary
The turtleback diagram offers an alternative visual representation of conditional probability, using set theory and Venn diagram elements to simplify calculations. It proves useful in various scenarios and is shown to be as expressive as traditional tree diagrams.
Paper Preview
Abstract
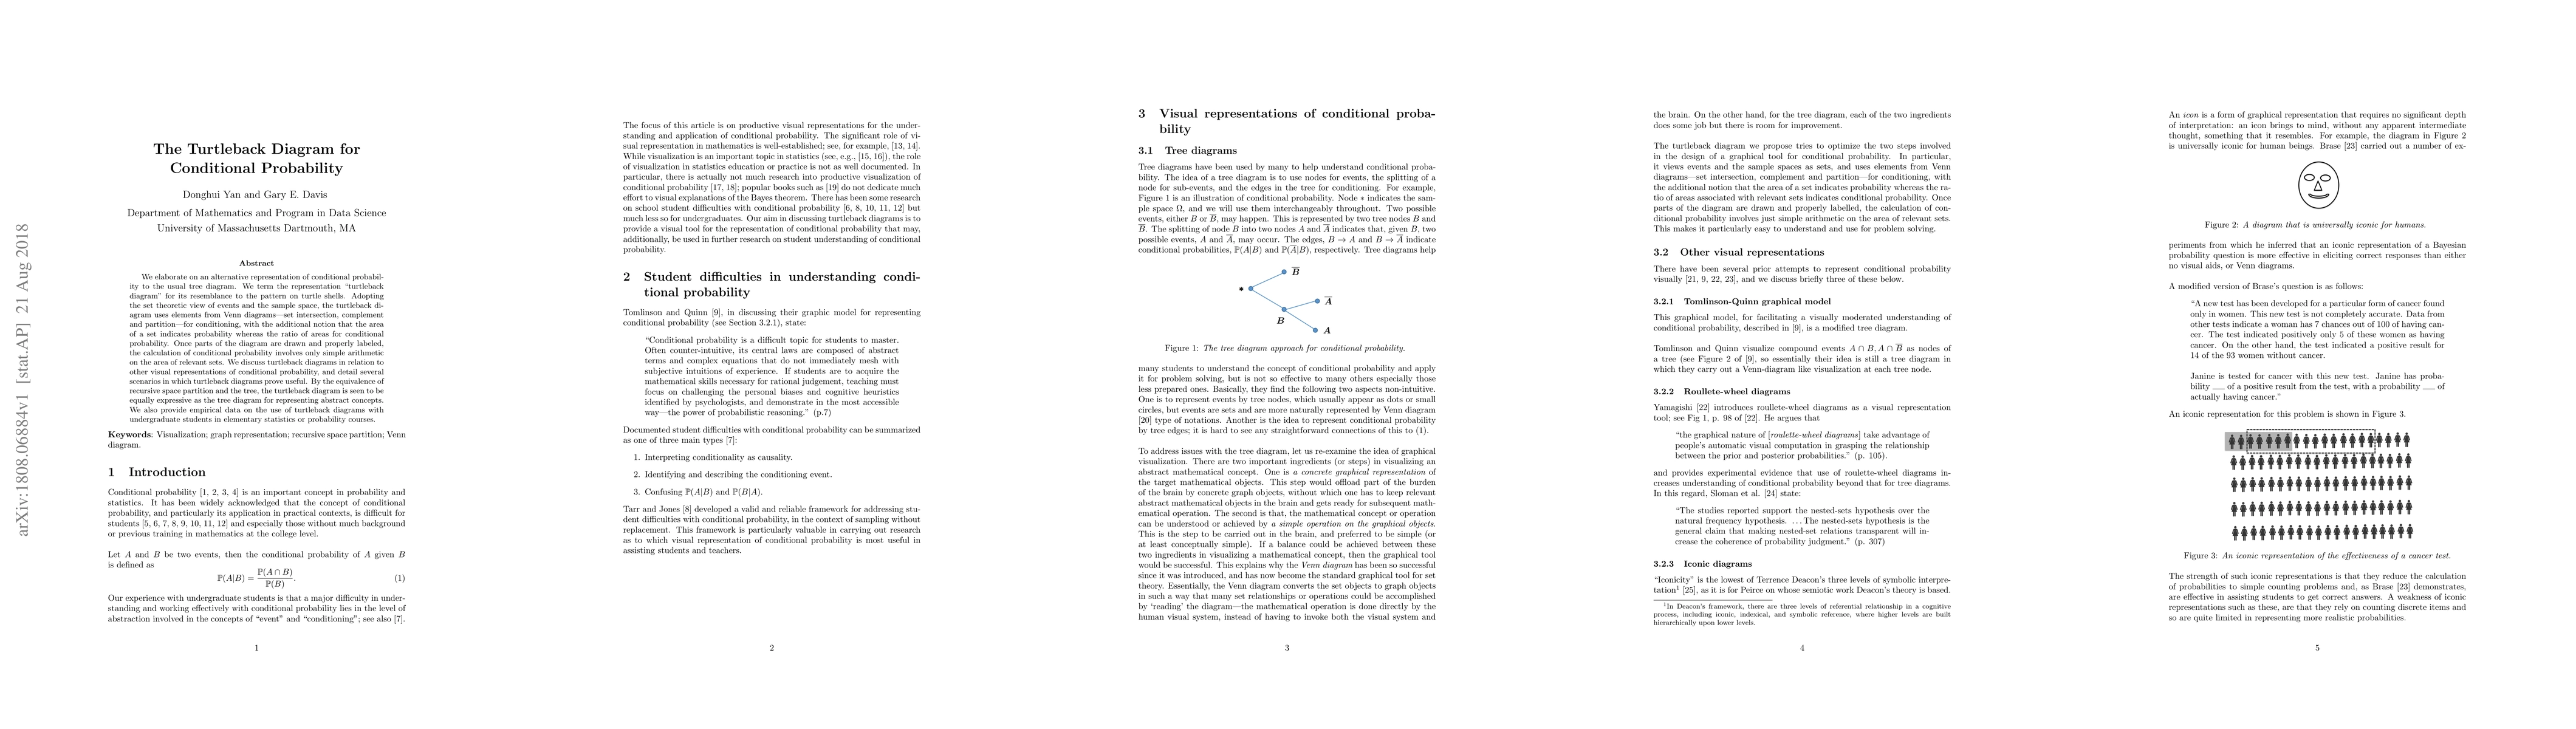
We elaborate on an alternative representation of conditional probability to the usual tree diagram. We term the representation `turtleback diagram' for its resemblance to the pattern on turtle shells. Adopting the set theoretic view of events and the sample space, the turtleback diagram uses elements from Venn diagrams---set intersection, complement and partition---for conditioning, with the additional notion that the area of a set indicates probability whereas the ratio of areas for conditional probability. Once parts of the diagram are drawn and properly labeled, the calculation of conditional probability involves only simple arithmetic on the area of relevant sets. We discuss turtleback diagrams in relation to other visual representations of conditional probability, and detail several scenarios in which turtleback diagrams prove useful. By the equivalence of recursive space partition and the tree, the turtleback diagram is seen to be equally expressive as the tree diagram for representing abstract concepts. We also provide empirical data on the use of turtleback diagrams with undergraduate students in elementary statistics or probability courses.
AI Key Findings
Get AI-generated insights about this paper's methodology, results, significance, and more — seven facets brought into focus.
Impact
Paper Details
PDF Preview
Key Terms
Citation Network
Current paper (gray), citations (green), references (blue)
Display is limited for performance on very large graphs.
Discussion 0