Summary
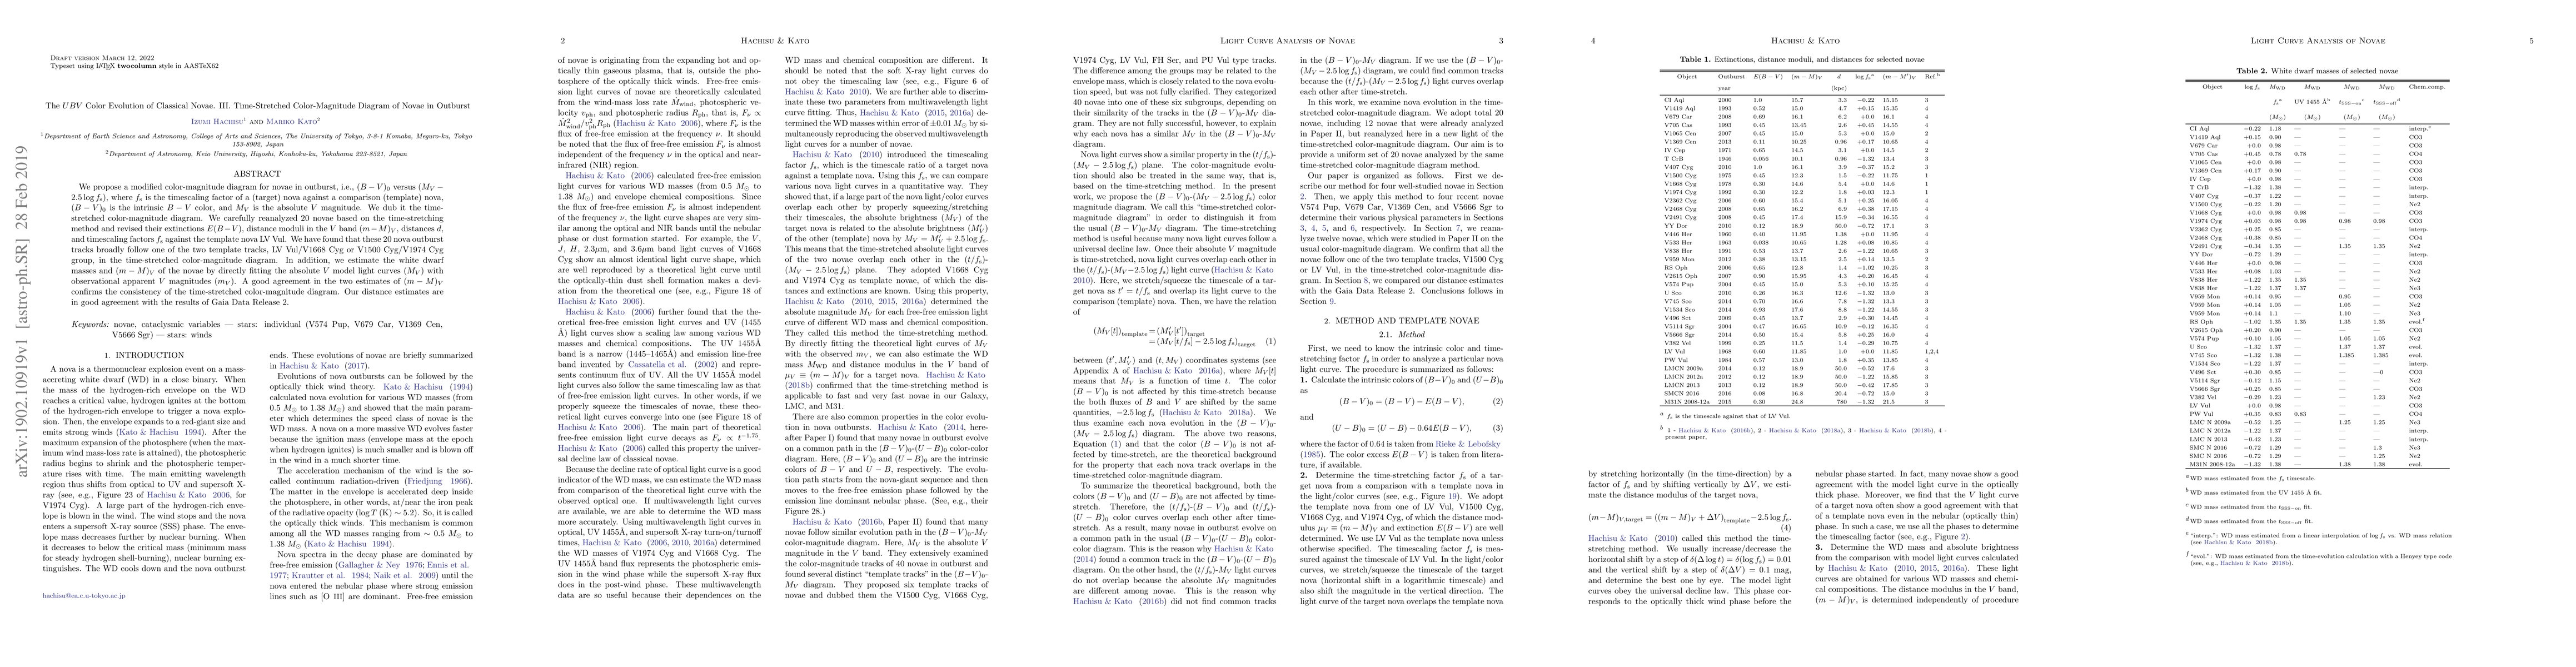
We propose a modified color-magnitude diagram for novae in outburst, i.e., $(B-V)_0$ versus $(M_V-2.5 \log f_{\rm s})$, where $f_{\rm s}$ is the timescaling factor of a (target) nova against a comparison (template) nova, $(B-V)_0$ is the intrinsic $B-V$ color, and $M_V$ is the absolute $V$ magnitude. We dub it the time-stretched color-magnitude diagram. We carefully reanalyzed 20 novae based on the time-stretching method and revised their extinctions $E(B-V)$, distance moduli in the $V$ band $(m-M)_V$, distances $d$, and timescaling factors $f_{\rm s}$ against the template nova LV Vul. We have found that these 20 nova outburst tracks broadly follow one of the two template tracks, LV Vul/V1668 Cyg or V1500 Cyg/V1974 Cyg group, in the time-stretched color-magnitude diagram. In addition, we estimate the white dwarf masses and $(m-M)_V$ of the novae by directly fitting the absolute $V$ model light curves ($M_V$) with observational apparent $V$ magnitudes ($m_V$). A good agreement in the two estimates of $(m-M)_V$ confirms the consistency of the time-stretched color-magnitude diagram. Our distance estimates are in good agreement with the results of Gaia Data Release 2.
AI Key Findings
Get AI-generated insights about this paper's methodology, results, and significance.
Paper Details
PDF Preview
Key Terms
Citation Network
Current paper (gray), citations (green), references (blue)
Display is limited for performance on very large graphs.
Similar Papers
Found 4 papers| Title | Authors | Year | Actions |
|---|
Comments (0)