Publication
Metrics
AI Quick Summary
The paper introduces a novel visual debugging tool designed to enhance program comprehension during debugging by graphically representing program execution in an object diagram, fully integrated with IntelliJ IDEA. The tool aims to reduce software maintenance costs by facilitating detailed exploration of execution information.
Paper Preview
Abstract
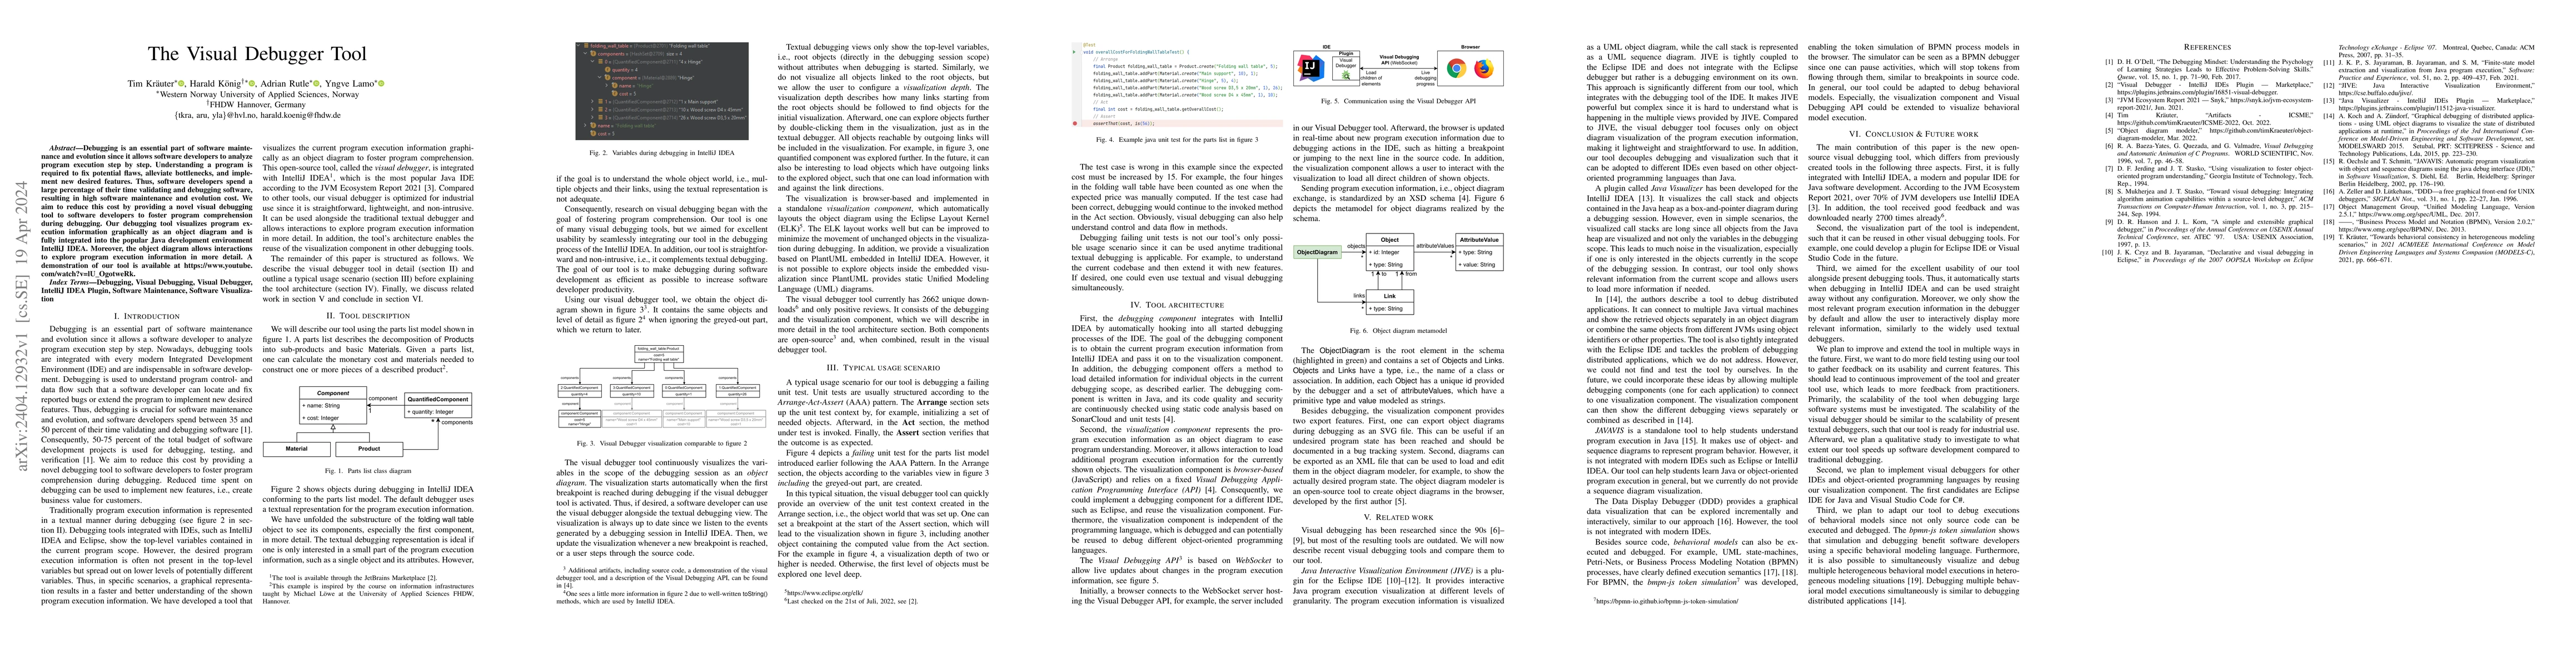
Debugging is an essential part of software maintenance and evolution since it allows software developers to analyze program execution step by step. Understanding a program is required to fix potential flaws, alleviate bottlenecks, and implement new desired features. Thus, software developers spend a large percentage of their time validating and debugging software, resulting in high software maintenance and evolution cost. We aim to reduce this cost by providing a novel visual debugging tool to software developers to foster program comprehension during debugging. Our debugging tool visualizes program execution information graphically as an object diagram and is fully integrated into the popular Java development environment IntelliJ IDEA. Moreover, the object diagram allows interactions to explore program execution information in more detail. A demonstration of our tool is available at https://www.youtube.com/watch?v=lU_OgotweRk.
AI Key Findings
Get AI-generated insights about this paper's methodology, results, significance, and more — seven facets brought into focus.
Impact
Paper Details
Authors
PDF Preview
Key Terms
Citation Network
Current paper (gray), citations (green), references (blue)
Display is limited for performance on very large graphs.
Discussion 0