Publication
Metrics
AI Quick Summary
This paper theoretically investigates phonon-assisted singlet-singlet relaxation in two-electron semiconductor quantum dot molecules, emphasizing the significant role of piezoelectric coupling over spin-orbit coupling. The study calculates relaxation rates for GaAs molecules, analyzing the effects of quantum dot size, distance, and temperature.
Paper Preview
Abstract
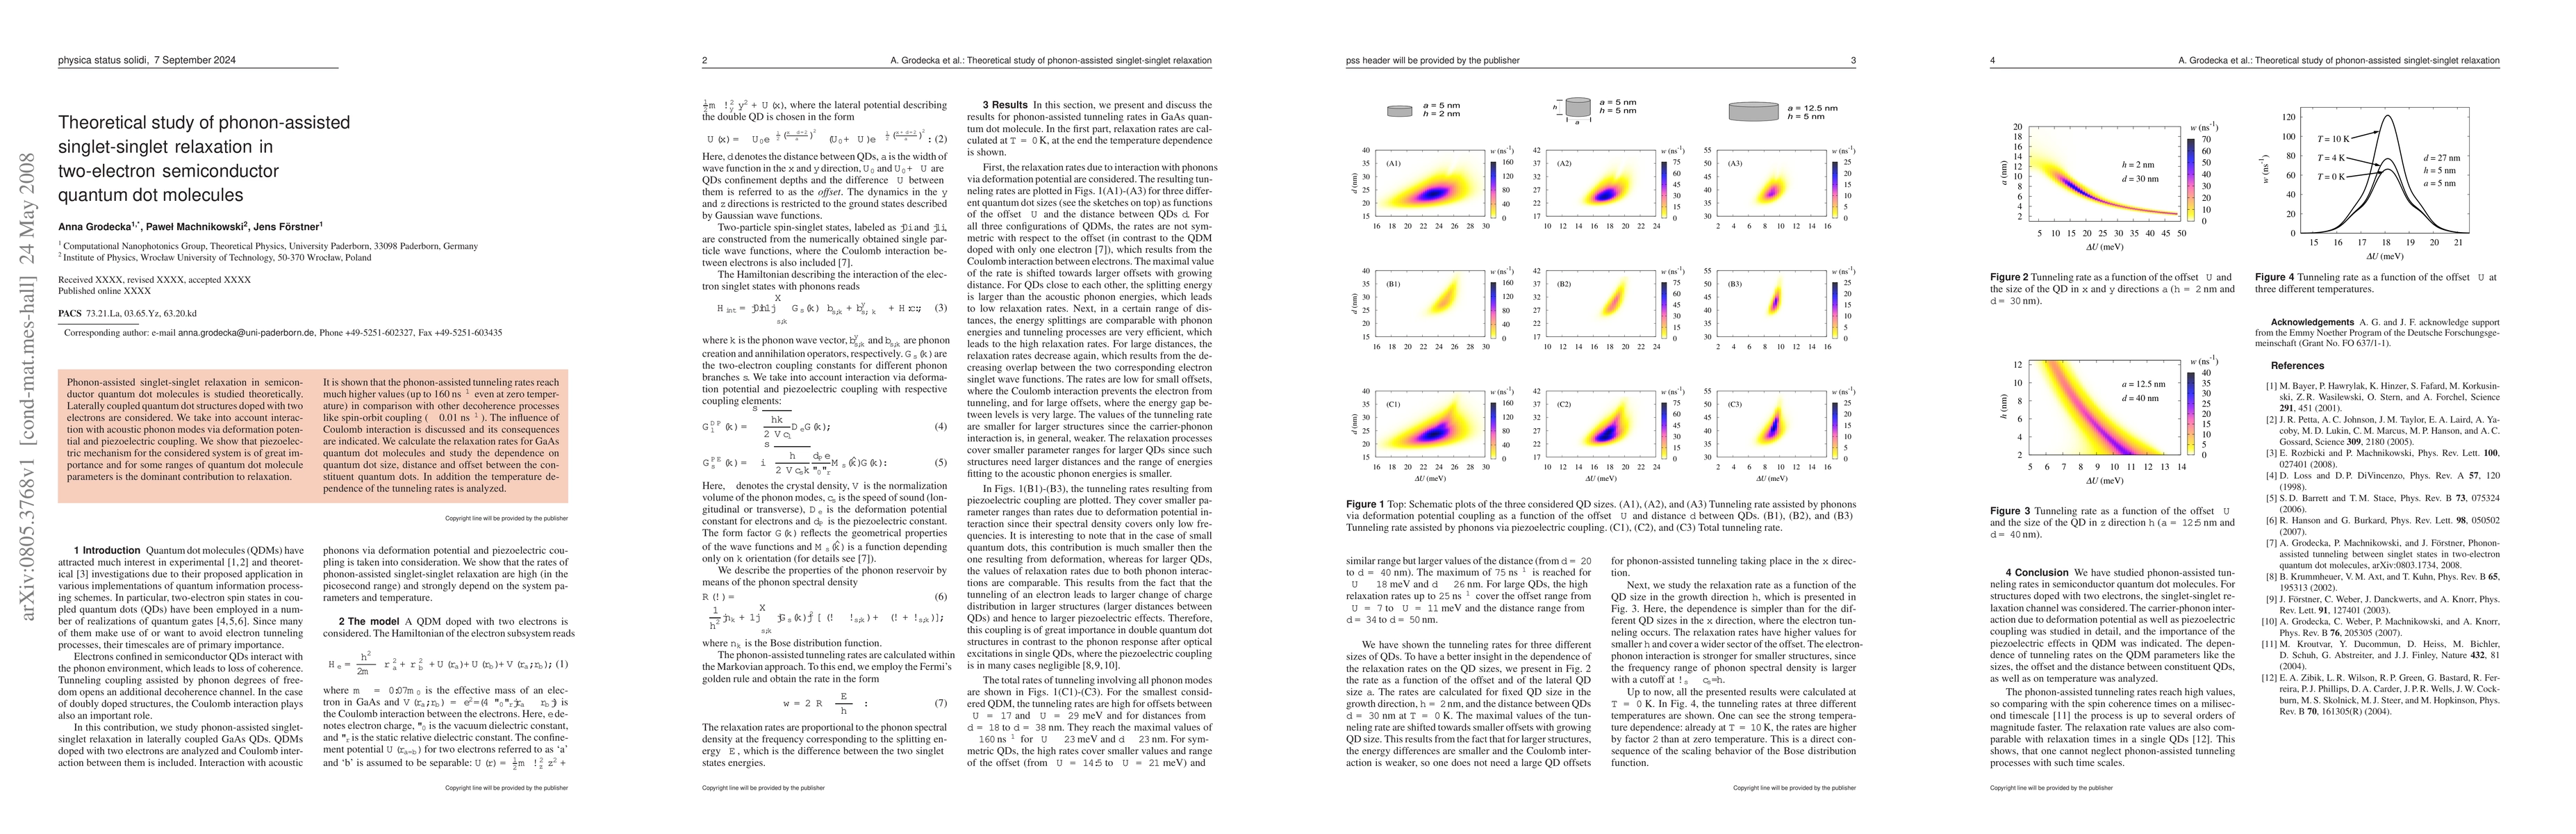
Phonon-assisted singlet-singlet relaxation in semiconductor quantum dot molecules is studied theoretically. Laterally coupled quantum dot structures doped with two electrons are considered. We take into account interaction with acoustic phonon modes via deformation potential and piezoelectric coupling. We show that piezoelectric mechanism for the considered system is of great importance and for some ranges of quantum dot molecule parameters is the dominant contribution to relaxation. It is shown that the phonon-assisted tunneling rates reach much higher values (up to 160 ns$^{-1}$ even at zero temperature) in comparison with other decoherence processes like spin-orbit coupling ($\sim$ 0.01 ns$^{-1}$). The influence of Coulomb interaction is discussed and its consequences are indicated. We calculate the relaxation rates for GaAs quantum dot molecules and study the dependence on quantum dot size, distance and offset between the constituent quantum dots. In addition the temperature dependence of the tunneling rates is analyzed.
AI Key Findings
Get AI-generated insights about this paper's methodology, results, significance, and more — seven facets brought into focus.
Impact
Paper Details
PDF Preview
Key Terms
Citation Network
Current paper (gray), citations (green), references (blue)
Display is limited for performance on very large graphs.
Discussion 0