Publication
Metrics
AI Quick Summary
This paper develops a new photoionization model using fractal geometry for HII regions, showing that turbulent ISM leads to complex ionization structures and significant scatter in optical diagnostic diagrams. The model highlights the necessity of complex nebular geometry for accurate modeling of high-redshift galaxies with highly turbulent ISM.
Paper Preview
Abstract
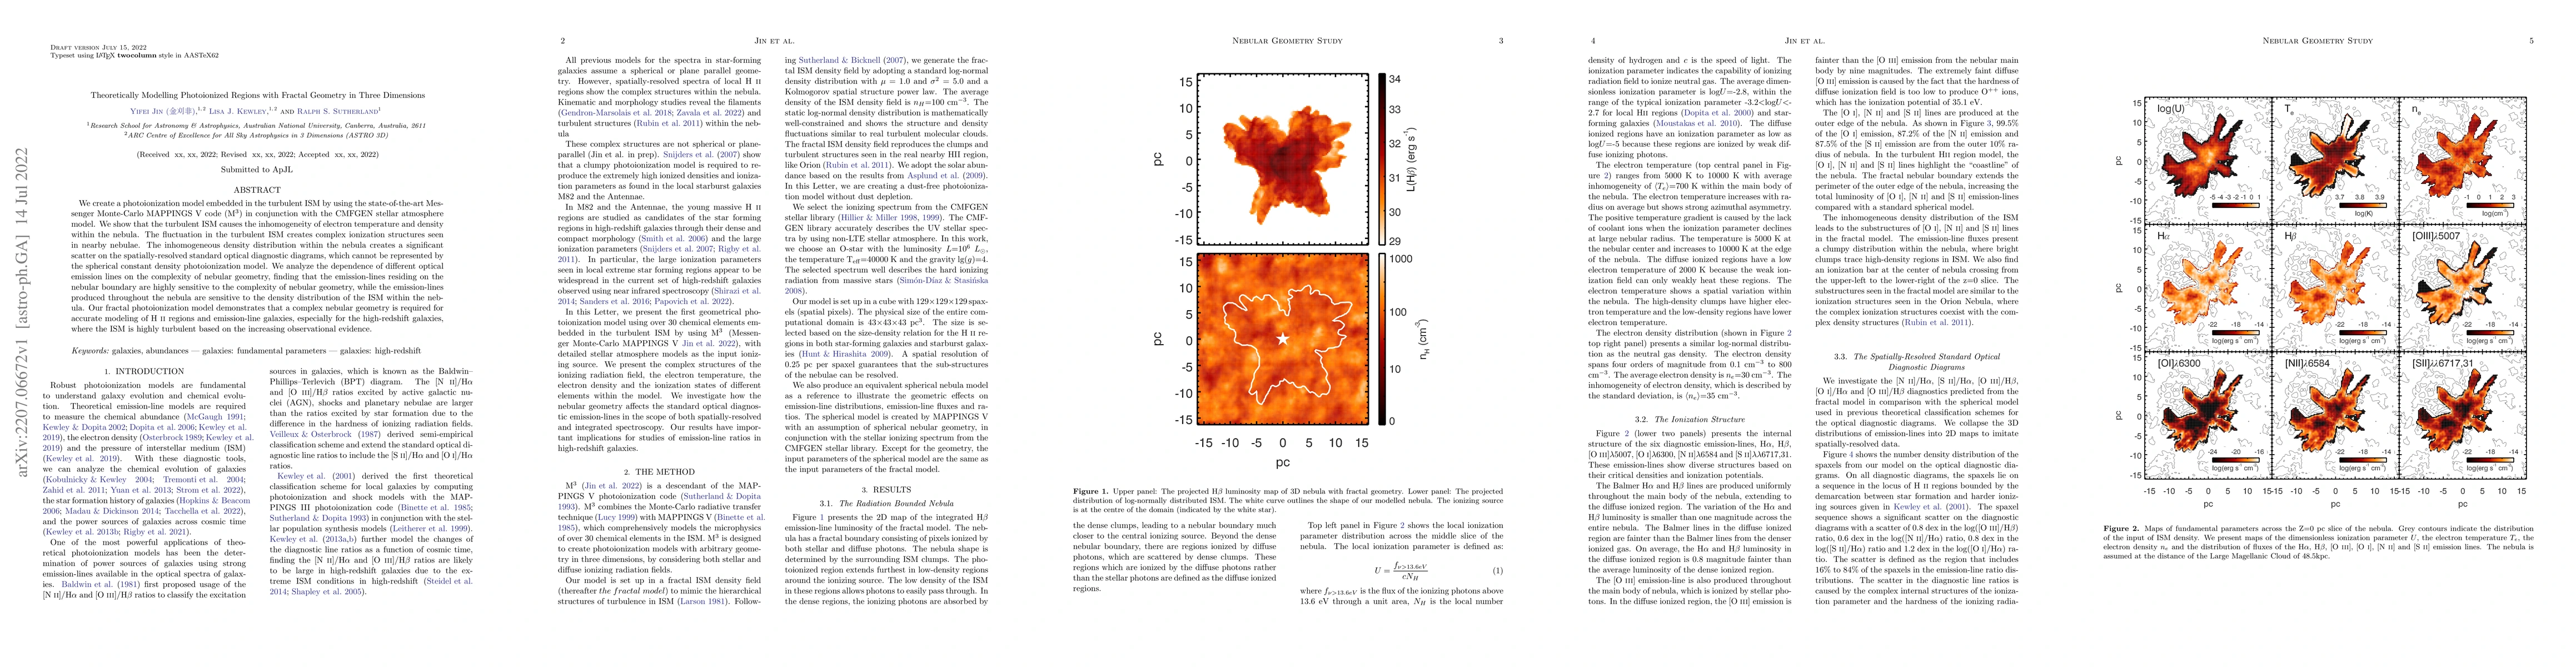
We create a photoionization model embedded in the turbulent ISM by using the state-of-the-art Messenger Monte-Carlo MAPPINGS~V code (M$^3$) in conjunction with the CMFGEN stellar atmosphere model. We show that the turbulent ISM causes the inhomogeneity of electron temperature and density within the nebula. The fluctuation in the turbulent ISM creates complex ionization structures seen in nearby nebulae. The inhomogeneous density distribution within the nebula creates a significant scatter on the spatially-resolved standard optical diagnostic diagrams, which cannot be represented by the spherical constant density photoionization model. We analyze the dependence of different optical emission lines on the complexity of nebular geometry, finding that the emission-lines residing on the nebular boundary are highly sensitive to the complexity of nebular geometry, while the emission-lines produced throughout the nebula are sensitive to the density distribution of the ISM within the nebula. Our fractal photoionization model demonstrates that a complex nebular geometry is required for accurate modeling of HII regions and emission-line galaxies, especially for the high-redshift galaxies, where the ISM is highly turbulent based on the increasing observational evidence.
AI Key Findings
Get AI-generated insights about this paper's methodology, results, significance, and more — seven facets brought into focus.
Impact
Paper Details
Authors
PDF Preview
Key Terms
Citation Network
Current paper (gray), citations (green), references (blue)
Display is limited for performance on very large graphs.
Discussion 0