Publication
Metrics
AI Quick Summary
This research optimizes the LiF-YF3 phase diagram using thermodynamic modeling, fitting Gibbs energy functions to literature and new experimental data from DTA and DSC measurements on HF-treated samples. The model accurately predicts the unique compound LiYF4's properties, aligning with experimental results.
Paper Preview
Abstract
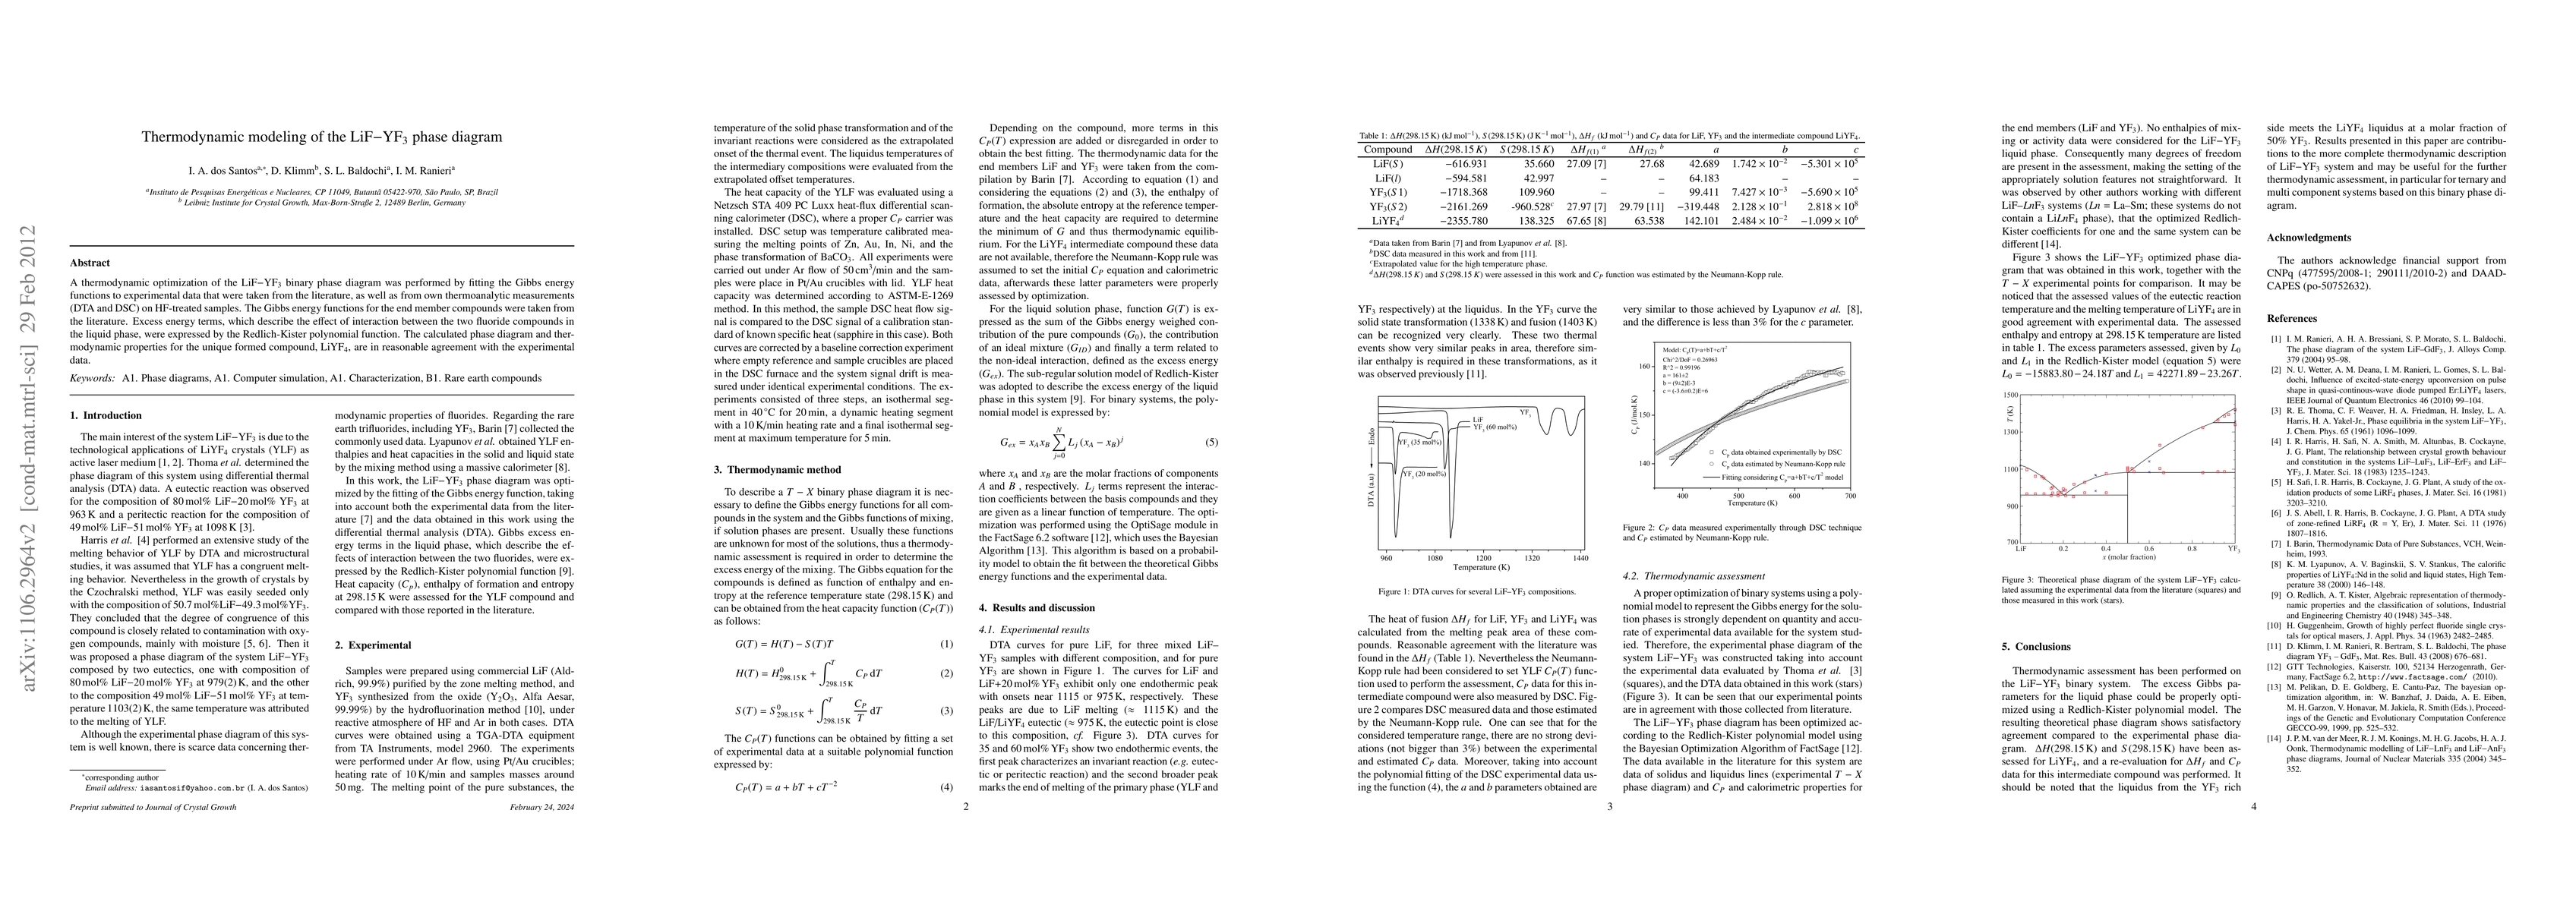
A thermodynamic optimization of the LiF-YF3 binary phase diagram was performed by fitting the Gibbs energy functions to experimental data that were taken from the literature, as well as from own thermoanalytic measurements (DTA and DSC) on HF-treated samples. The Gibbs energy functions for the end member compounds were taken from the literature. Excess energy terms, which describe the effect of interaction between the two fluoride compounds in the liquid phase, were expressed by the Redlich-Kister polynomial function. The calculated phase diagram and thermodynamic properties for the unique formed compound, LiYF4, are in reasonable agreement with the experimental data.
AI Key Findings
Get AI-generated insights about this paper's methodology, results, significance, and more — seven facets brought into focus.
Impact
Paper Details
PDF Preview
Key Terms
Citation Network
Current paper (gray), citations (green), references (blue)
Display is limited for performance on very large graphs.
Discussion 0