Thermoelectric phase diagram of the SrTiO3-SrNbO3 solid solution system
Publication
Metrics
Paper Preview
Abstract
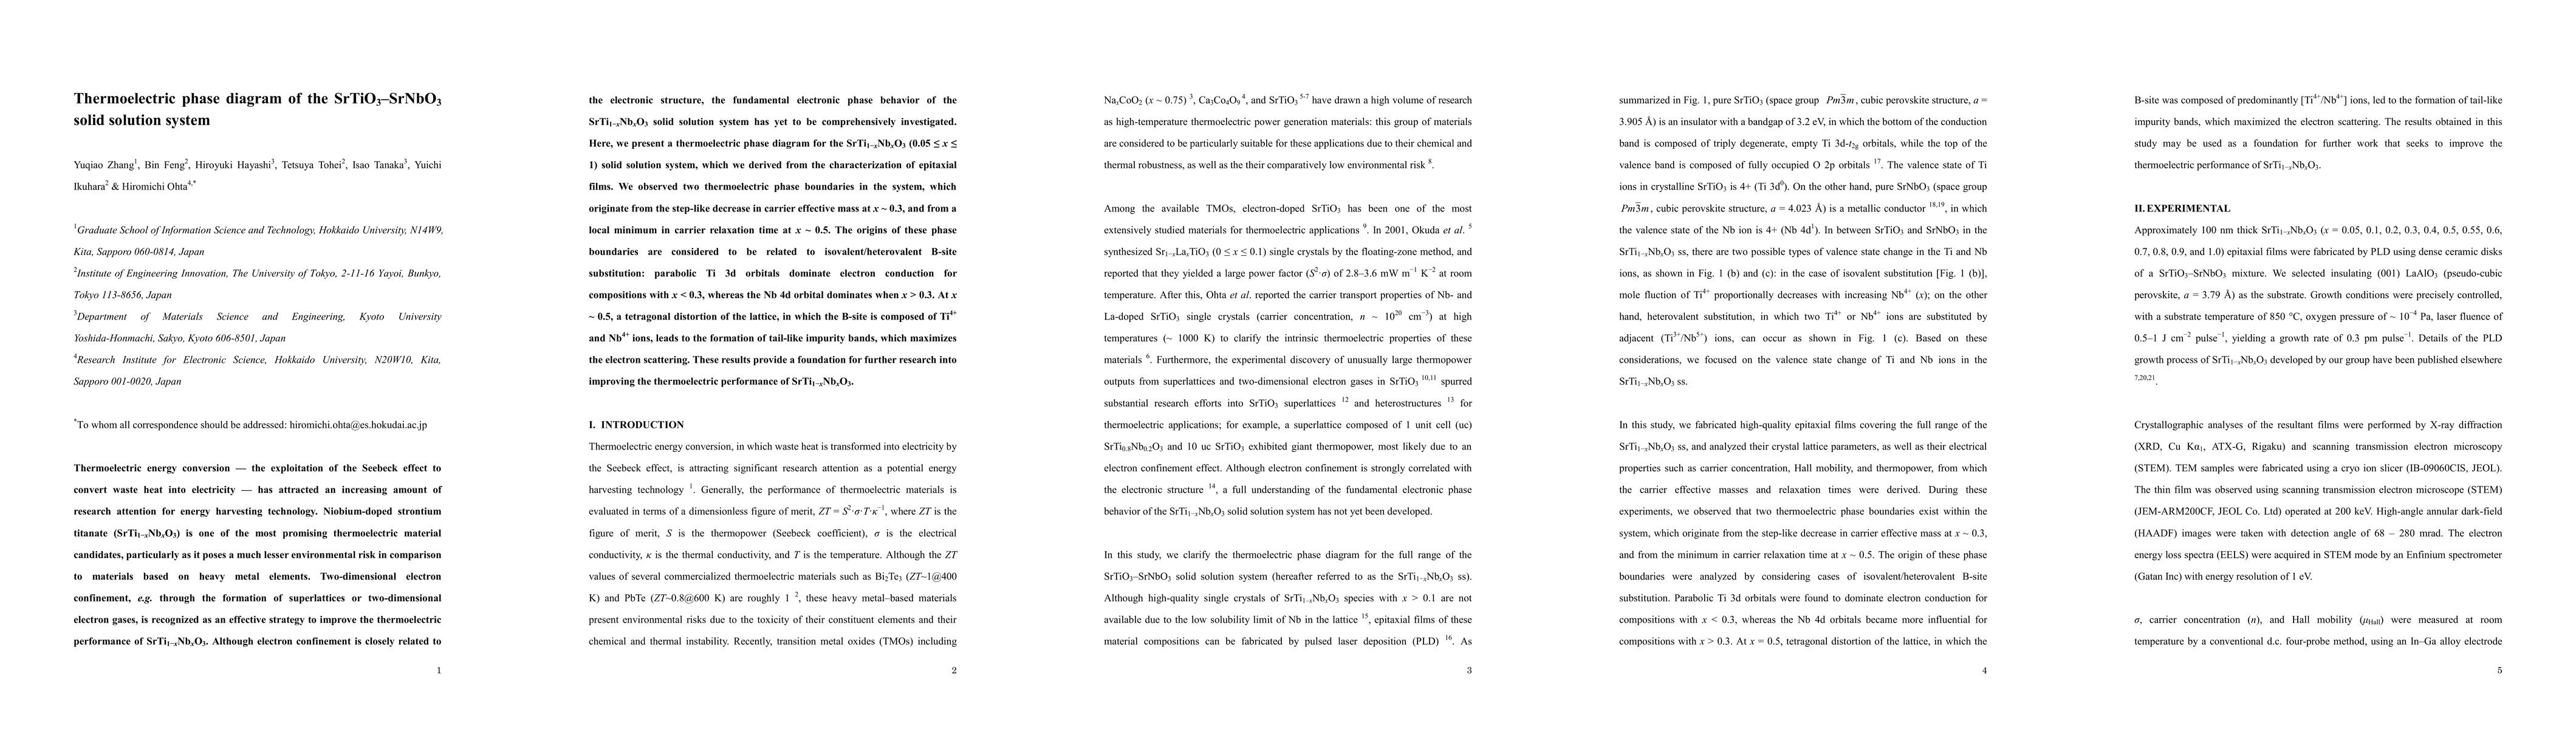
Thermoelectric energy conversion - the exploitation of the Seebeck effect to convert waste heat into electricity - has attracted an increasing amount of research attention for energy harvesting technology. Niobium-doped strontium titanate (SrTi1-xNbxO3) is one of the most promising thermoelectric material candidates, particularly as it poses a much lesser environmental risk in comparison to materials based on heavy metal elements. Two-dimensional electron confinement, e.g. through the formation of superlattices or two-dimensional electron gases, is recognized as an effective strategy to improve the thermoelectric performance of SrTi1-xNbxO3. Although electron confinement is closely related to the electronic structure, the fundamental electronic phase behavior of the SrTi1-xNbxO3 solid solution system has yet to be comprehensively investigated. Here, we present a thermoelectric phase diagram for the SrTi1-xNbxO3 (0.05 =< x =< 1) solid solution system, which we derived from the characterization of epitaxial films. We observed two thermoelectric phase boundaries in the system, which originate from the step-like decrease in carrier effective mass at x ~ 0.3, and from a local minimum in carrier relaxation time at x ~ 0.5. The origins of these phase boundaries are considered to be related to isovalent/heterovalent B-site substitution: parabolic Ti 3d orbitals dominate electron conduction for compositions with x < 0.3, whereas the Nb 4d orbital dominates when x > 0.3. At x ~ 0.5, a tetragonal distortion of the lattice, in which the B-site is composed of Ti4+ and Nb4+ ions, leads to the formation of tail-like impurity bands, which maximizes the electron scattering. These results provide a foundation for further research into improving the thermoelectric performance of SrTi1-xNbxO3.
AI Key Findings
Get AI-generated insights about this paper's methodology, results, significance, and more — seven facets brought into focus.
Impact
Paper Details
PDF Preview
Key Terms
Citation Network
Current paper (gray), citations (green), references (blue)
Display is limited for performance on very large graphs.
Discussion 0