Thixotropic spectra and Ashby-style charts for thixotropy
Publication
Metrics
AI Quick Summary
This paper proposes a generalized framework for comparing thixotropic properties using thixotropic spectra and Ashby-style charts. It employs a superposition of exponential stress modes to quantify thixotropic behavior, validated through experimental data on colloidal suspensions, and aims to support both scientific research and material selection in engineering.
Paper Preview
Abstract
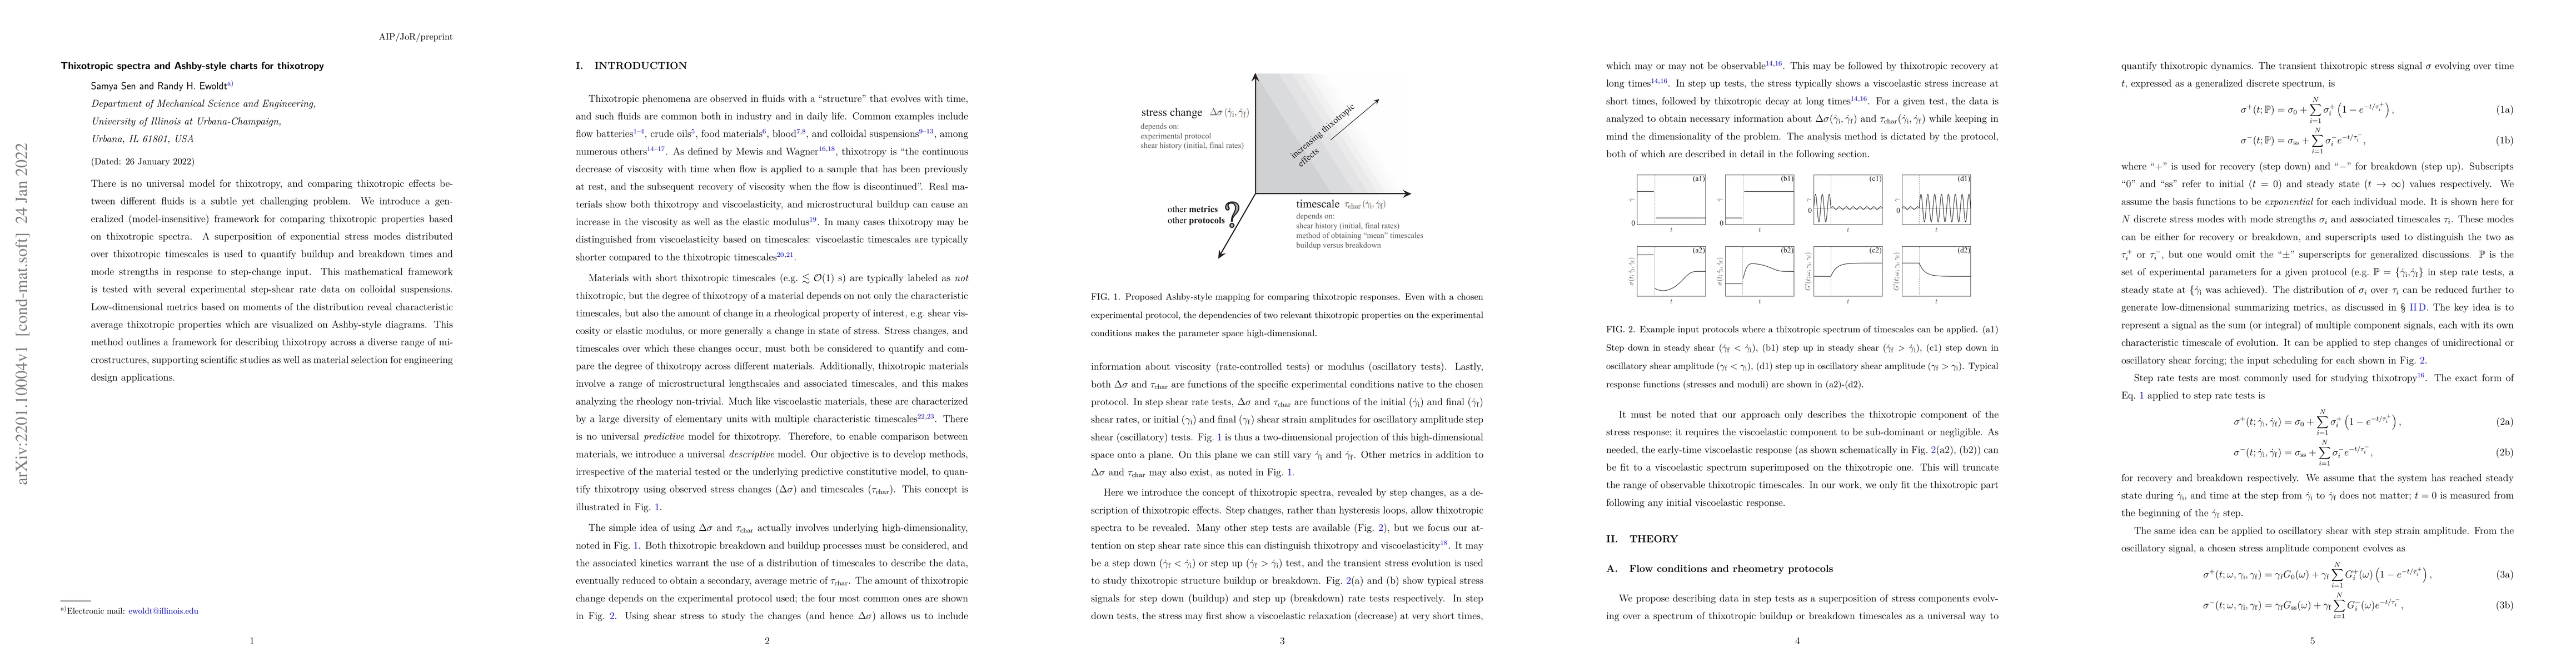
There is no universal model for thixotropy, and comparing thixotropic effects between different fluids is a subtle yet challenging problem. We introduce a generalized (model-insensitive) framework for comparing thixotropic properties based on thixotropic spectra. A superposition of exponential stress modes distributed over thixotropic timescales is used to quantify buildup and breakdown times and mode strengths in response to step-change input. This mathematical framework is tested with several experimental step-shear rate data on colloidal suspensions. Low-dimensional metrics based on moments of the distribution reveal characteristic average thixotropic properties which are visualized on Ashby-style diagrams. This method outlines a framework for describing thixotropy across a diverse range of microstructures, supporting scientific studies as well as material selection for engineering design applications.
AI Key Findings
Get AI-generated insights about this paper's methodology, results, significance, and more — seven facets brought into focus.
Impact
Paper Details
Authors
PDF Preview
Key Terms
Citation Network
Current paper (gray), citations (green), references (blue)
Display is limited for performance on very large graphs.
Discussion 0