Publication
Metrics
AI Quick Summary
This paper revisits Thomson's multitaper method from a linear algebra perspective, providing nonasymptotic bounds and showing that using $K=2NW-O(\log(NW))$ tapers improves leakage protection for high dynamic range power spectra. It also introduces an $\epsilon$-approximation requiring fewer FFTs for efficient evaluation.
Paper Preview
Abstract
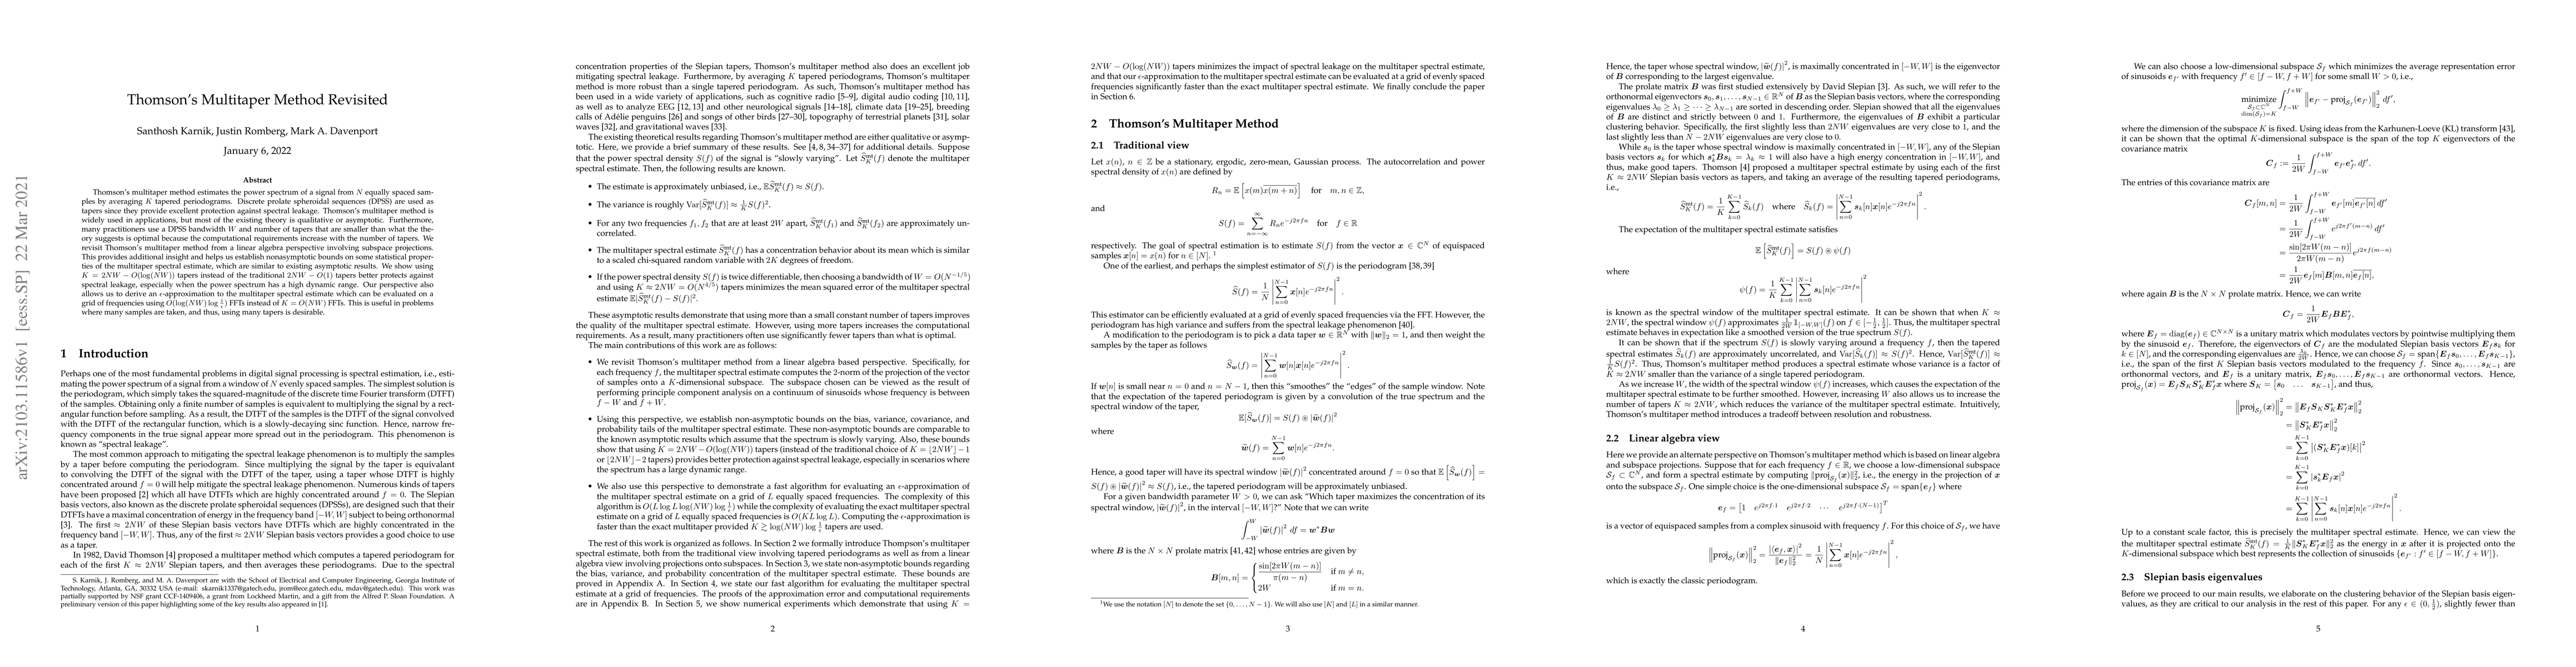
Thomson's multitaper method estimates the power spectrum of a signal from $N$ equally spaced samples by averaging $K$ tapered periodograms. Discrete prolate spheroidal sequences (DPSS) are used as tapers since they provide excellent protection against spectral leakage. Thomson's multitaper method is widely used in applications, but most of the existing theory is qualitative or asymptotic. Furthermore, many practitioners use a DPSS bandwidth $W$ and number of tapers that are smaller than what the theory suggests is optimal because the computational requirements increase with the number of tapers. We revisit Thomson's multitaper method from a linear algebra perspective involving subspace projections. This provides additional insight and helps us establish nonasymptotic bounds on some statistical properties of the multitaper spectral estimate, which are similar to existing asymptotic results. We show using $K=2NW-O(\log(NW))$ tapers instead of the traditional $2NW-O(1)$ tapers better protects against spectral leakage, especially when the power spectrum has a high dynamic range. Our perspective also allows us to derive an $\epsilon$-approximation to the multitaper spectral estimate which can be evaluated on a grid of frequencies using $O(\log(NW)\log\tfrac{1}{\epsilon})$ FFTs instead of $K=O(NW)$ FFTs. This is useful in problems where many samples are taken, and thus, using many tapers is desirable.
AI Key Findings
Get AI-generated insights about this paper's methodology, results, significance, and more — seven facets brought into focus.
Impact
Paper Details
Authors
PDF Preview
Key Terms
Citation Network
Current paper (gray), citations (green), references (blue)
Display is limited for performance on very large graphs.
Discussion 0