This paper explores the use of thought experiments in design fiction to visualize future possibilities and reinterpret existing scenarios. It defines a thought experiment as comprising a situation, a story, and a scenario, and presents ten such experiments to demonstrate their utility in provoking critical reflection and novel approaches in visualization research.
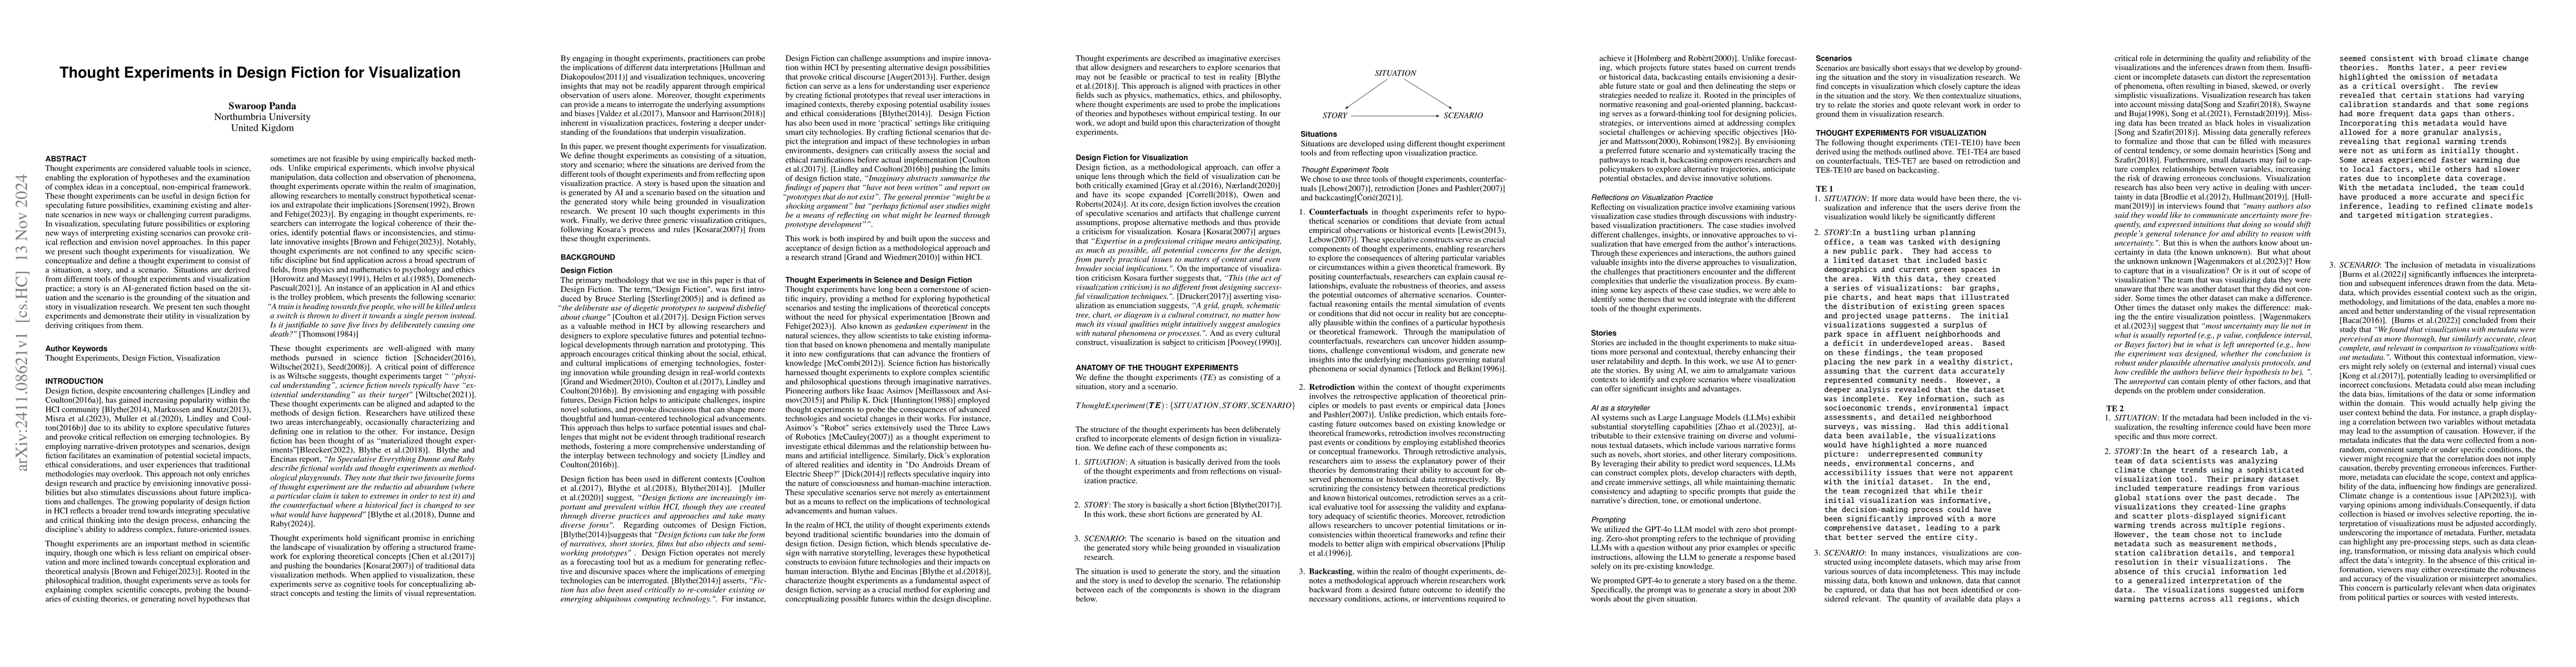
Thought experiments are considered valuable tools in science, enabling the exploration of hypotheses and the examination of complex ideas in a conceptual, non-empirical framework. These thought experiments can be useful in design fiction for speculating future possibilities, examining existing and alternate scenarios in new ways or challenging current paradigms. In visualization, speculating future possibilities or exploring new ways of interpreting existing scenarios can provoke critical reflection and envision novel approaches. In this paper we present such thought experiments for visualization. We conceptualize and define a thought experiment to consist of a situation, a story, and a scenario. Situations are derived from different tools of thought experiments and visualization practice; a story is an AI-generated fiction based on the situation and the scenario is the grounding of the situation and story in visualization research. We present ten such thought experiments and demonstrate their utility in visualization by deriving critiques from them.
Get AI-generated insights about this paper's methodology, results, and significance.
Current paper (gray), citations (green), references (blue)
Niklas Elmqvist, Fanny Chevalier, Safwat Ali Khan et al.
Yan Xia, Li Dong, Shaoguang Mao et al.
No citations found for this paper.
Title | Authors | Year | Actions |
---|---|---|---|
To Cut or Not To Cut? A Systematic Exploration of Y-Axis Truncation
|
Sheng Long, Matthew Kay
|
2024
|
View Paper |
Facing the Unknown Unknowns of Data Analysis
|
E. Wagenmakers, A. Sarafoglou, B. Aczél
|
2023
|
View Paper |
Misleading Beyond Visual Tricks: How People Actually Lie with Charts
|
Maxim Lisnic, Cole Polychronis, A. Lex, M. Kogan
|
2023
|
View Paper |
Responsive Visualization Design for Mobile Devices
|
Tom Horak, W. Aigner, M. Brehmer, Alark Joshi, C. Tominski
|
2021
|
View Paper |
Understanding the Effects of Visualizing Missing Values on Visual Data Exploration
|
Hayeong Song, Yu Fu, B. Saket, J. Stasko
|
2021
|
View Paper |
What Can CHI Do About Dark Patterns?
|
Kai Lukoff, Alexis Hiniker, Colin M. Gray, Arunesh Mathur, S. Chivukula
|
2021
|
View Paper |
Thought Experiments in Law
|
Gabriel Doménech-Pascual
|
2021
|
View Paper |
How People Are Influenced by Deceptive Tactics in Everyday Charts and Graphs
|
C. Lauer, Shaun O'Brien
|
2020
|
View Paper |
Misrepresenting COVID-19: Lying With Charts During the Second Golden Age of Data Design
|
Sara Doan
|
2020
|
View Paper |
The political significance of data visualization: Four key perspectives
|
Torgeir Uberg Nærland
|
2020
|
View Paper |
A Task-Based Taxonomy of Cognitive Biases for Information Visualization
|
Evanthia Dimara, S. Franconeri, C. Plaisant, A. Bezerianos, Pierre Dragicevic
|
2020
|
View Paper |
Why Authors Don't Visualize Uncertainty
|
J. Hullman
|
2019
|
View Paper |
Illusion of Causality in Visualized Data
|
Cindy Xiong, Joel K Shapiro, J. Hullman, S. Franconeri
|
2019
|
View Paper |
Vis4Vis: Visualization for (Empirical) Visualization Research
|
D. Weiskopf
|
2019
|
View Paper |
The Forever War: understanding, science fiction, and thought experiments
|
H. Wiltsche
|
2019
|
View Paper |
Do Androids Dream of Electric Sheep?
|
Philip K Dick
|
2018
|
View Paper |
To identify what is not there: A definition of missingness patterns and evaluation of missing value visualization
|
S. Fernstad
|
2018
|
View Paper |
Research Fiction and Thought Experiments in Design
|
M. Blythe, Enrique Encinas
|
2018
|
View Paper |
Information visualization and/as enunciation
|
J. Drucker
|
2017
|
View Paper |
Internal and External Visual Cue Preferences for Visualizations in Presentations
|
H. Kong, Zhicheng Liu, Karrie Karahalios
|
2017
|
View Paper |
Research Fiction: Storytelling, Plot and Design
|
M. Blythe
|
2017
|
View Paper |
Design fiction as world building
|
P. Coulton, Joseph Lindley, Miriam Sturdee, M. Stead
|
2017
|
View Paper |
Creating an Understanding of Data Literacy for a Data-driven Society
|
A. Wolff, D. Gooch, Jose J. Cavero Montaner, Umar Rashid, Gerd Kortuem
|
2016
|
View Paper |
Pushing the Limits of Design Fiction: The Case For Fictional Research Papers
|
Joseph Lindley, P. Coulton
|
2016
|
View Paper |
Introduction: Thought Experiments: Science Fiction as a Window into Philosophical Puzzles
|
Susan Schneider
|
2016
|
View Paper |
What is the Trolley Problem
|
Eong Jinkyu, 김신
|
2015
|
View Paper |
A Principled Way of Assessing Visualization Literacy
|
Jeremy Boy, Ronald A. Rensink, E. Bertini, Jean-Daniel Fekete
|
2014
|
View Paper |
Research through design fiction: narrative in real and imaginary abstracts
|
M. Blythe
|
2014
|
View Paper |
The poetics of design fiction
|
T. Markussen, Eva Knutz
|
2013
|
View Paper |
Patterns for visualization evaluation
|
N. Elmqvist, Ji Soo Yi
|
2012
|
View Paper |
Thought Experiment, Defi nition, and Literary Fiction
|
Geordie Mccomb
|
2012
|
View Paper |
Empirical Studies in Information Visualization: Seven Scenarios
|
Heidi Lam, E. Bertini, Petra Isenberg, C. Plaisant, Sheelagh Carpendale
|
2012
|
View Paper |
Visualization Rhetoric: Framing Effects in Narrative Visualization
|
J. Hullman, N. Diakopoulos
|
2011
|
View Paper |
Using color in visualization: A survey
|
S. Silva, B. Santos, Joaquim S. Madeira
|
2011
|
View Paper |
A Nested Model for Visualization Design and Validation
|
T. Munzner
|
2009
|
View Paper |
The Data Warehouse Lifecycle Toolkit
|
R. Kimball, Margy Ross, Warren Thornthwaite, Joy Mundy, Bob Becker
|
2009
|
View Paper |
Usability evaluation considered harmful (some of the time)
|
S. Greenberg, W. Buxton
|
2008
|
View Paper |
Visualization Criticism - The Missing Link Between Information Visualization and Art
|
Robert Kosara
|
2007
|
View Paper |
AI Armageddon and the Three Laws of Robotics
|
Lee McCauley
|
2007
|
View Paper |
Is the mind inherently forward looking? Comparing prediction and retrodiction
|
Jason Jeffrey Jones, H. Pashler
|
2007
|
View Paper |
Counterfactual Thought Experiments: A Necessary Teaching Tool
|
R. Lebow
|
2007
|
View Paper |
Scenario!
|
B. Dunnigan
|
2004
|
View Paper |
Design Choices when Architecting Visualizations†
|
Diane Tang, Chris Stolte, Robert P. Bosch
|
2003
|
View Paper |
Backcasting — a framework for strategic planning
|
J. Holmberg, K. Robèrt
|
2000
|
View Paper |
Determinism and backcasting in futures studies
|
M. Höjer, L. Mattsson
|
2000
|
View Paper |
Missing Data in Interactive High-Dimensional Data Visualization
|
Deborah F. Swayne, A. Buja
|
1998
|
View Paper |
Hyperdimensional Data Analysis Using Parallel Coordinates
|
E. Wegman
|
1990
|
View Paper |
Data-Ink Maximization and Graphical Design
|
E. Tufte
|
1990
|
View Paper |
Philip K. Dick: Authenticity and Insincerity
|
John Huntington
|
1988
|
View Paper |
Thought experiments and physics education
|
H. Helm, J. Gilbert, D. M. Watts
|
1985
|
View Paper |
Energy backcasting A proposed method of policy analysis
|
John Robinson
|
1982
|
View Paper |
Counterfactuals
|
D. Makinson
|
1974
|
View Paper |
Situation
|
E. H. Wilson
|
1927
|
View Paper |
. Design fiction: A short essay on design, science, fact, and fiction
|
2022
|
||
How charts lie: Getting smarter about visual information
|
2019
|
||
Modeling Color Difference for Visualization Design
|
D. Szafir
|
2018
|
View Paper |
Data Visualization Literacy and Visualization Biases: Cases for Merging Parallel Threads
|
Hamid Mansoor, Lane Harrison
|
2018
|
View Paper |
Pathways for Theoretical Advances in Visualization
|
Min Chen, G. Grinstein, Chris R. Johnson, J. Kennedy, Melanie Tory
|
2017
|
View Paper |
A Framework for Studying Biases in Visualization Research
|
Calero Valdez, Martina Ziefle, Michael Sedlmair
|
2017
|
View Paper |
STORY : The story is basically a short fiction
|
2017
|
||
Data Visualization: Representing Information on Modern Web
|
2016
|
||
A Review of Uncertainty in Data Visualization
|
K. Brodlie, R. S. A. Osorio, Adriano Lopes
|
2012
|
View Paper |
Properties and Best Uses of Visual Encodings
|
2012
|
||
Information Visualization and Visual Data Mining
|
D. Keim
|
2002
|
View Paper |
Counterfactual Thought Experiments in World Politics Logical, Methodological, and Psychological Perspectives
|
P. Tetlock, A. Belkin
|
1996
|
View Paper |
Thought experiments in science and philosophy
|
T. Horowitz, Gerald J. Massey
|
1991
|
View Paper |
team of architects and city planners relied on a sophisticated data visualization device to analyze traffic flow and pedestrian movement in the city center
|
|||
the heart of a research lab
|
|||
consumer behavior trends over the past year using a new visualization tool
|
|||
three-dimensional medical image visualization
|
|||
2024. Design Contradictions: Help or Hindrance?
|
|||
a bustling urban planning office, a team was tasked with designing a new public park
|
|||
In a public health organization, a team was tasked with analyzing and presenting data on vaccination rates across different regions
|
|||
2024. Speculative Everything, With a new preface by the authors: Design, Fiction, and Social Dreaming
|
Showing first page preview. Click "Open Full PDF" to view the complete paper.
Your comment contains inappropriate language and has been rejected.
Are you sure you want to remove this tag? This action cannot be undone.
Someone just favorited a paper!
Comments (0)