Publication
Metrics
AI Quick Summary
Tilt Map presents an innovative interaction technique for transitioning between 2D choropleth maps, 3D prism maps, and 2D bar charts in immersive environments, addressing the limitations of each. User studies show prism maps improve task accuracy while choropleth maps reduce response times, leading to the hybrid Tilt Map design that enhances user preference, accuracy, and efficiency.
Paper Preview
Abstract
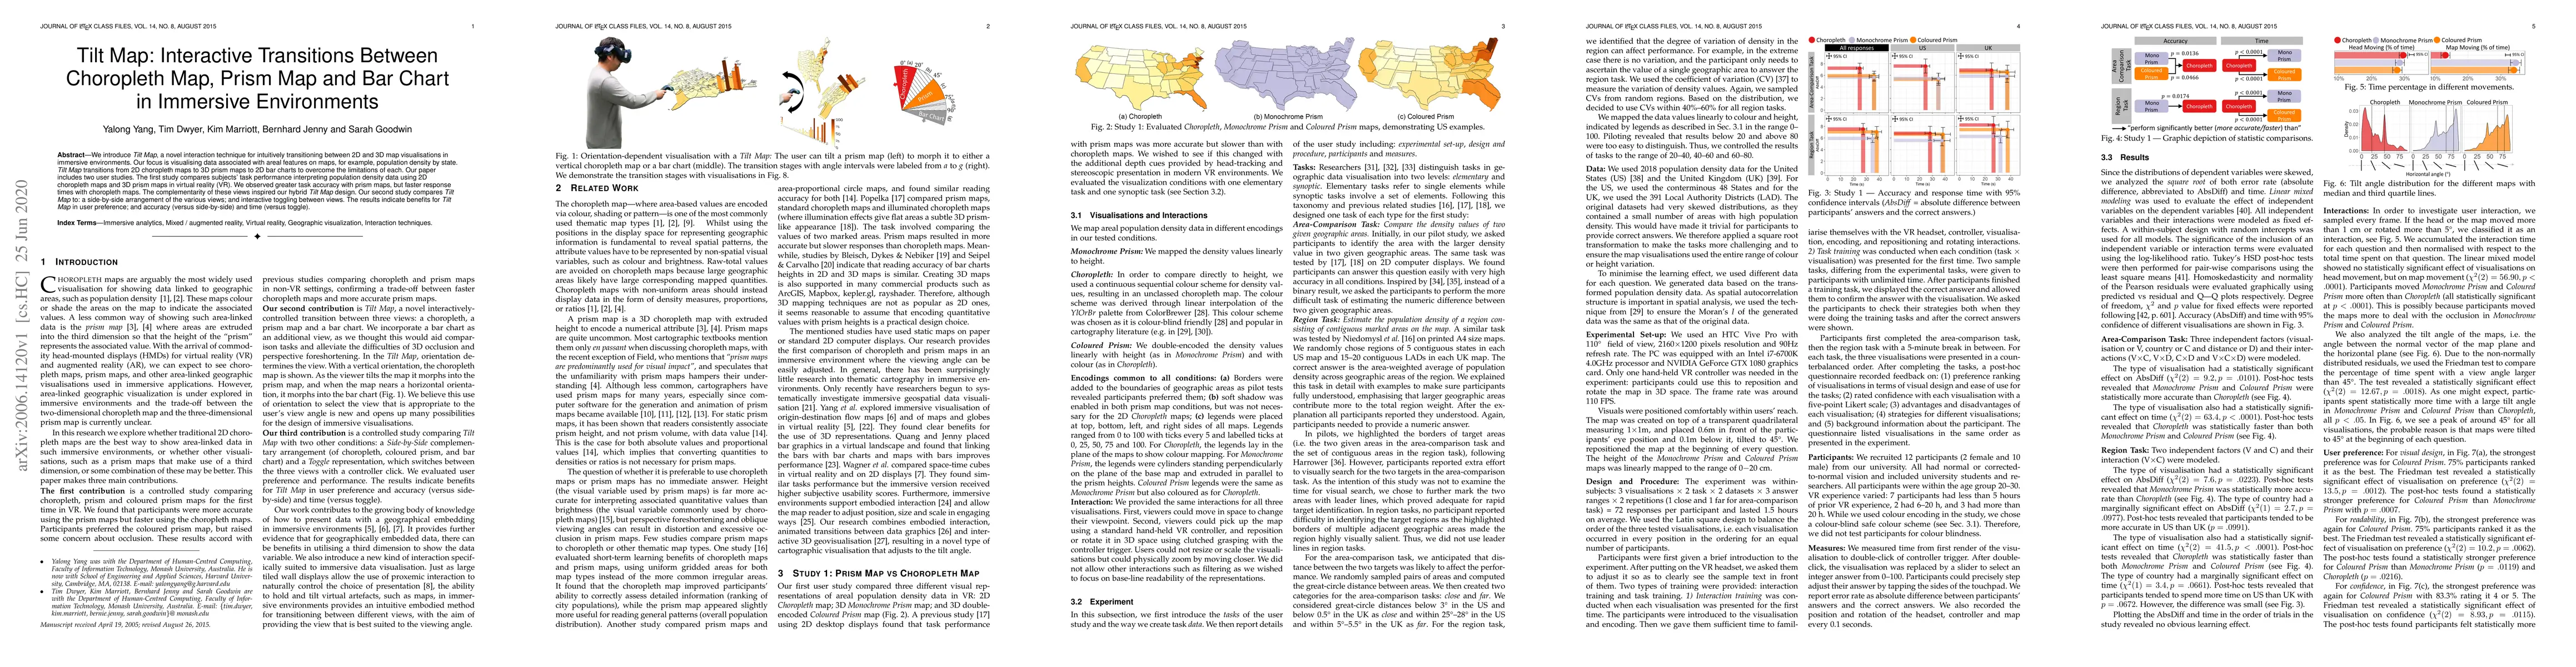
We introduce Tilt Map, a novel interaction technique for intuitively transitioning between 2D and 3D map visualisations in immersive environments. Our focus is visualising data associated with areal features on maps, for example, population density by state. Tilt Map transitions from 2D choropleth maps to 3D prism maps to 2D bar charts to overcome the limitations of each. Our paper includes two user studies. The first study compares subjects' task performance interpreting population density data using 2D choropleth maps and 3D prism maps in virtual reality (VR). We observed greater task accuracy with prism maps, but faster response times with choropleth maps. The complementarity of these views inspired our hybrid Tilt Map design. Our second study compares Tilt Map to: a side-by-side arrangement of the various views; and interactive toggling between views. The results indicate benefits for Tilt Map in user preference; and accuracy (versus side-by-side) and time (versus toggle).
AI Key Findings
Get AI-generated insights about this paper's methodology, results, significance, and more — seven facets brought into focus.
Impact
Paper Details
Authors
PDF Preview
Key Terms
Citation Network
Current paper (gray), citations (green), references (blue)
Display is limited for performance on very large graphs.
Discussion 0