Summary
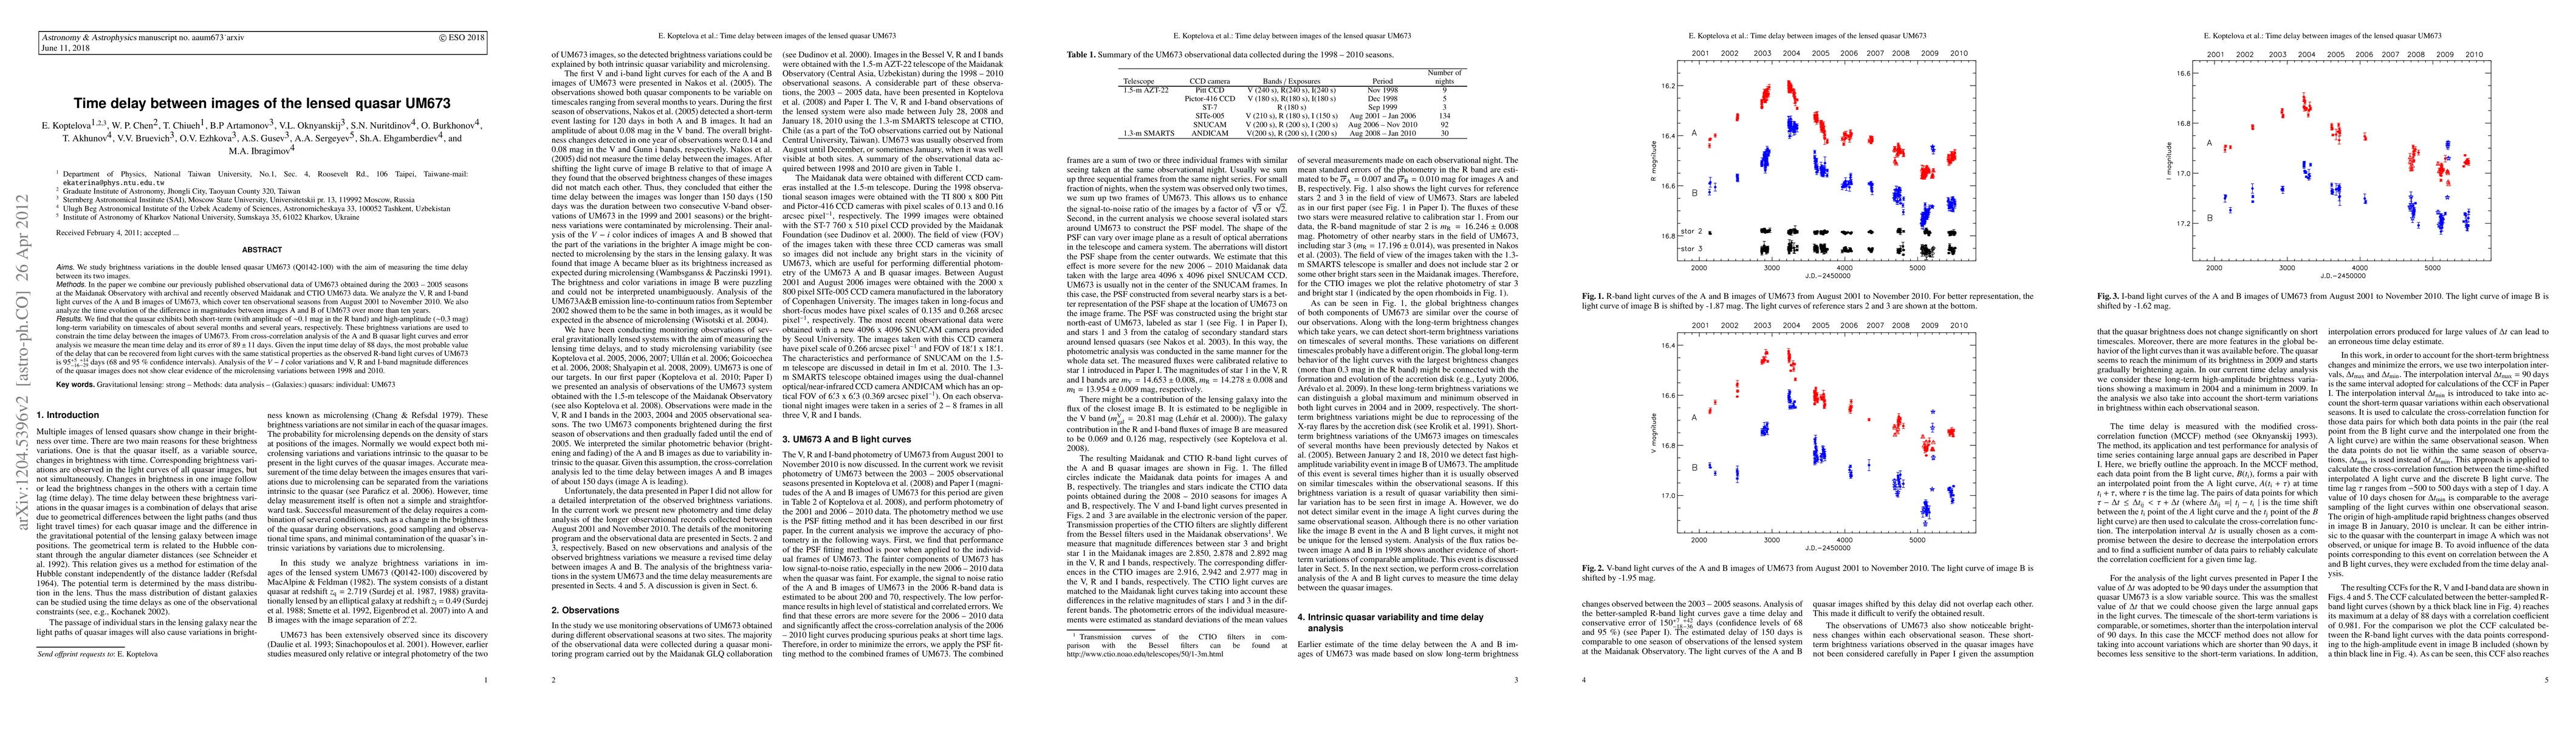
We study brightness variations in the double lensed quasar UM673 (Q0142-100) with the aim of measuring the time delay between its two images. In the paper we combine our previously published observational data of UM673 obtained during the 2003 - 2005 seasons at the Maidanak Observatory with archival and recently observed Maidanak and CTIO UM673 data. We analyze the V, R and I-band light curves of the A and B images of UM673, which cover ten observational seasons from August 2001 to November 2010. We also analyze the time evolution of the difference in magnitudes between images A and B of UM673 over more than ten years. We find that the quasar exhibits both short-term (with amplitude of \sim 0.1 mag in the R band) and high-amplitude (\sim 0.3 mag) long-term variability on timescales of about several months and several years, respectively. These brightness variations are used to constrain the time delay between the images of UM673. From cross-correlation analysis of the A and B quasar light curves and error analysis we measure the mean time delay and its error of 89 \pm11 days. Given the input time delay of 88 days, the most probable value of the delay that can be recovered from light curves with the same statistical properties as the observed R-band light curves of UM673 is 95{+5/-16}{+14/-29} days (68 and 95 % confidence intervals). Analysis of the V - I color variations and V, R and I-band magnitude differences of the quasar images does not show clear evidence of the microlensing variations between 1998 and 2010.
AI Key Findings
Get AI-generated insights about this paper's methodology, results, and significance.
Paper Details
PDF Preview
Key Terms
Citation Network
Current paper (gray), citations (green), references (blue)
Display is limited for performance on very large graphs.
Similar Papers
Found 4 papers| Title | Authors | Year | Actions |
|---|
Comments (0)