Publication
Metrics
AI Quick Summary
This paper investigates the time evolution of non-linear relationships in currency markets using dynamic networks based on short time windows. It employs the Hirschfeld-Gebelein-Renyi Maximum Correlation Coefficient and Randomized Dependence Coefficient to capture non-linear dependencies, creating minimally spanning trees for each time window to analyze the degree distributions and their economic implications.
Paper Preview
Abstract
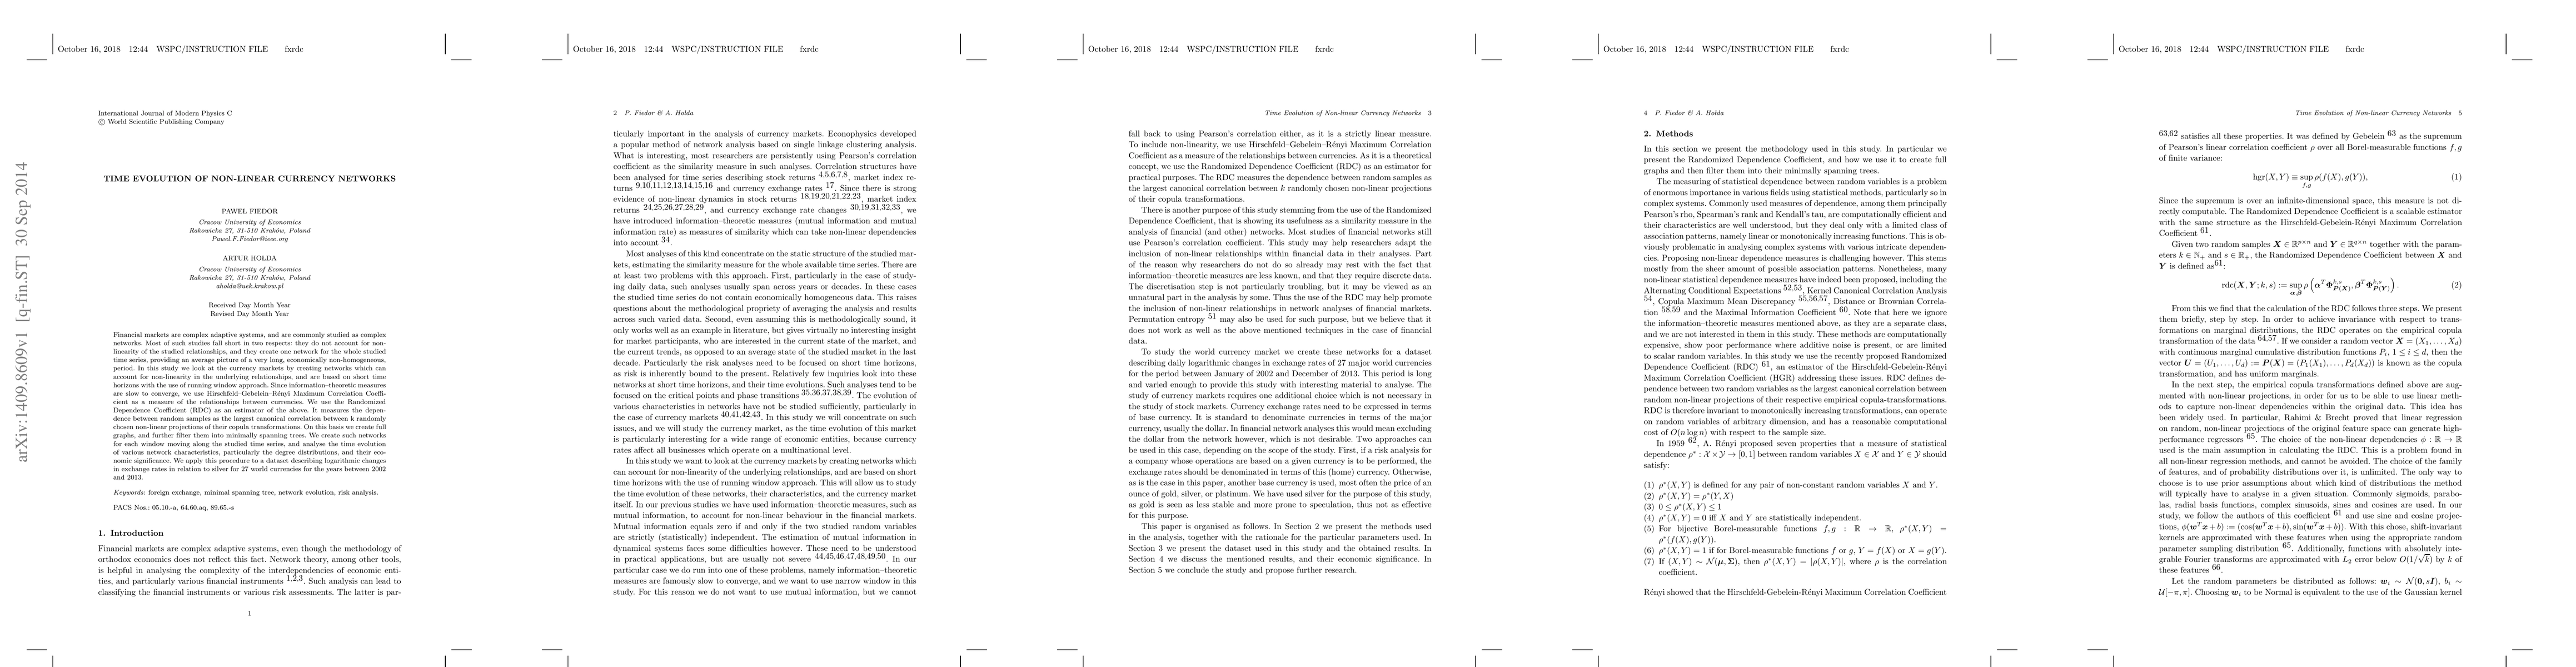
Financial markets are complex adaptive systems, and are commonly studied as complex networks. Most of such studies fall short in two respects: they do not account for non-linearity of the studied relationships, and they create one network for the whole studied time series, providing an average picture of a very long, economically non-homogeneous, period. In this study we look at the currency markets by creating networks which can account for non-linearity in the underlying relationships, and are based on short time horizons with the use of running window approach. Since information--theoretic measures are slow to converge, we use Hirschfeld-Gebelein-Renyi Maximum Correlation Coefficient as a measure of the relationships between currencies. We use the Randomized Dependence Coefficient (RDC) as an estimator of the above. It measures the dependence between random samples as the largest canonical correlation between k randomly chosen non-linear projections of their copula transformations. On this basis we create full graphs, and further filter them into minimally spanning trees. We create such networks for each window moving along the studied time series, and analyse the time evolution of various network characteristics, particularly the degree distributions, and their economic significance. We apply this procedure to a dataset describing logarithmic changes in exchange rates in relation to silver for 27 world currencies for the years between 2002 and 2013.
AI Key Findings
Get AI-generated insights about this paper's methodology, results, significance, and more — seven facets brought into focus.
Impact
Paper Details
PDF Preview
Key Terms
Citation Network
Current paper (gray), citations (green), references (blue)
Display is limited for performance on very large graphs.
Discussion 0