Summary
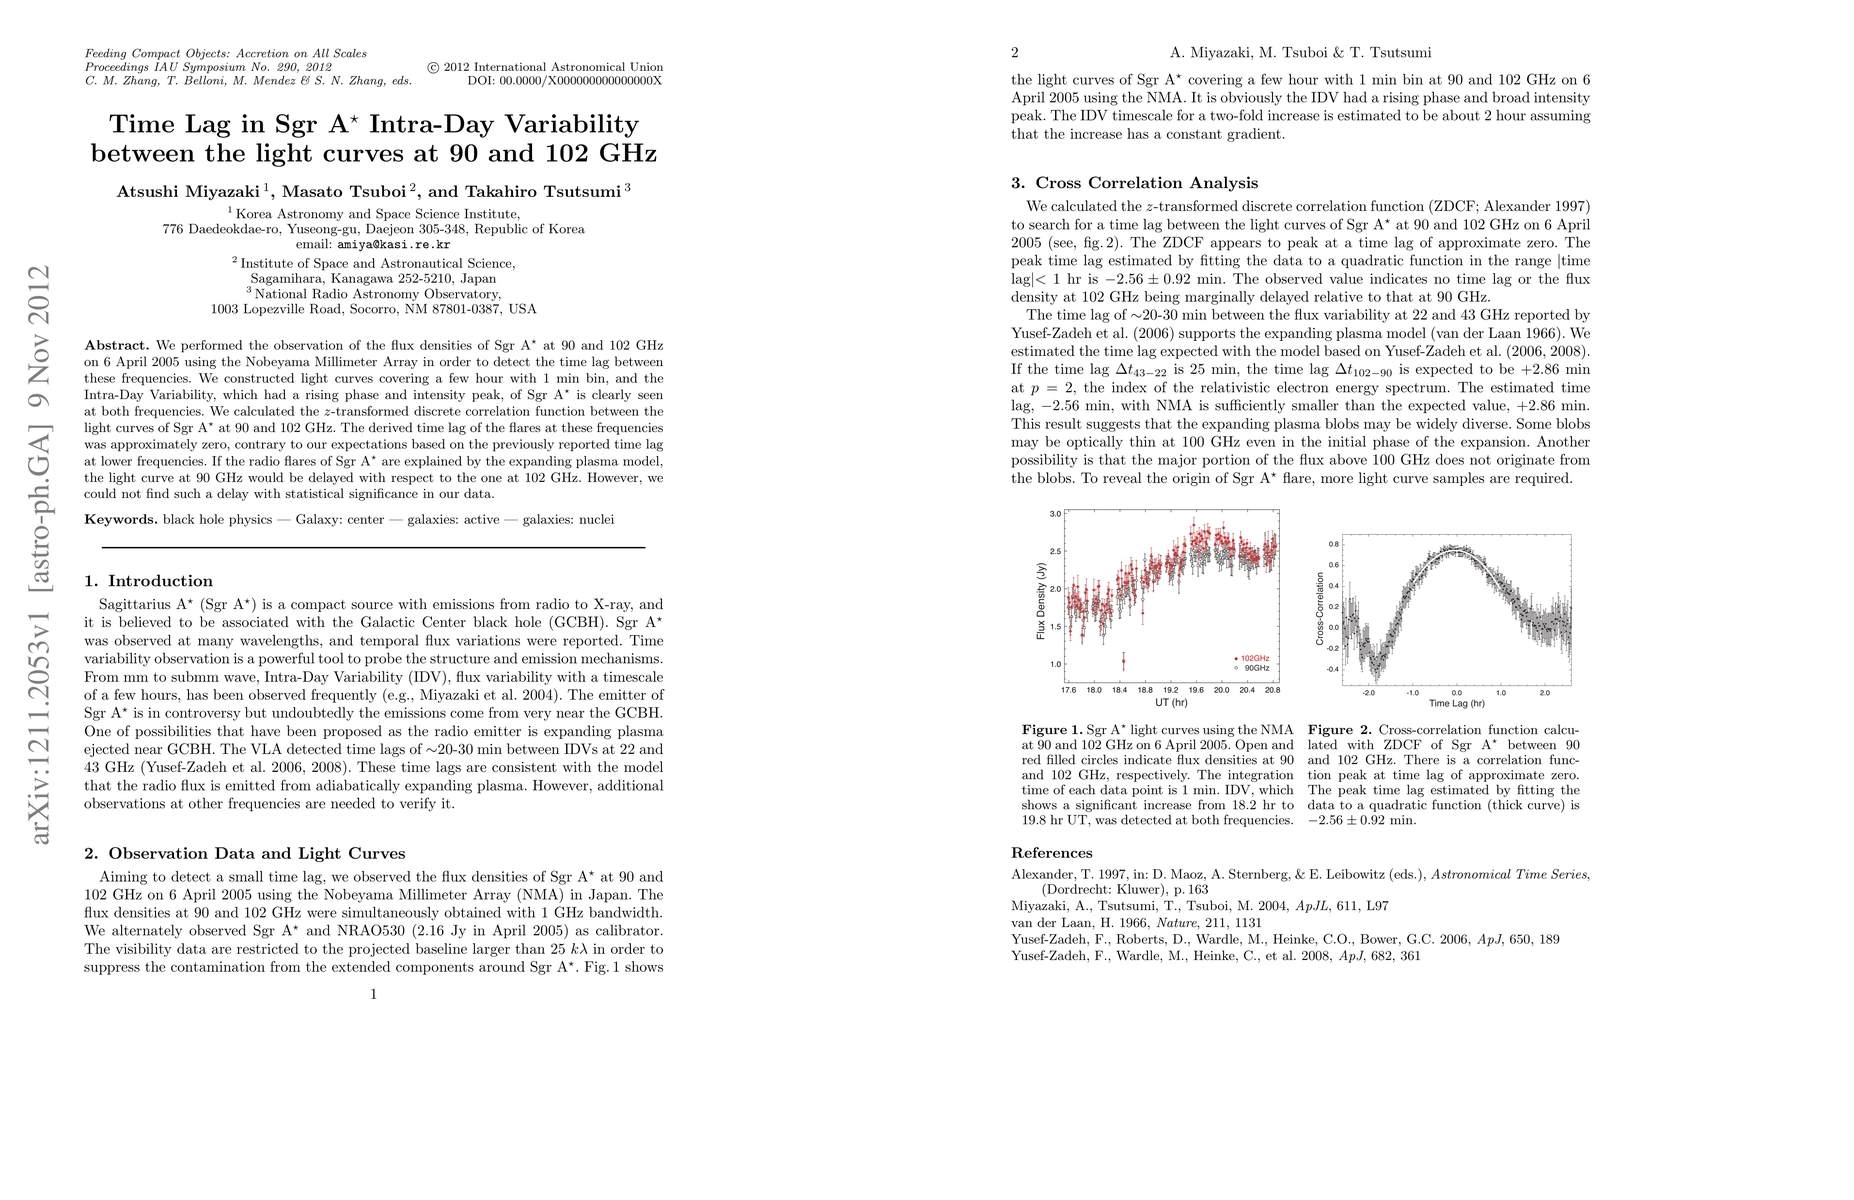
We performed the observation of the flux densities of Sgr A* at 90 and 102 GHz on 6 April 2005 using the Nobeyama Millimeter Array in order to detect the time lag between these frequencies. We constructed light curves covering a few hour with 1 min bin, and the Intra-Day Variability, which had a rising phase and intensity peak, of Sgr A* is clearly seen at both frequencies. We calculated the z-transformed discrete correlation function between the light curves of Sgr A* at 90 and 102 GHz. The derived time lag of the flares at these frequencies was approximately zero, contrary to our expectations based on the previously reported time lag at lower frequencies. If the radio flares of Sgr A* are explained by the expanding plasma model, the light curve at 90 GHz would be delayed with respect to the one at 102 GHz. However, we could not find such a delay with statistical significance in our data.
AI Key Findings
Get AI-generated insights about this paper's methodology, results, and significance.
Paper Details
PDF Preview
Key Terms
Citation Network
Current paper (gray), citations (green), references (blue)
Display is limited for performance on very large graphs.
No citations found for this paper.
Comments (0)