Time-Series Event Prediction with Evolutionary State Graph
Publication
Metrics
AI Quick Summary
This paper introduces an evolutionary state graph to represent the dynamic transitions among states in time-series data, proposing a graph neural network model, EvoNet, to predict future events by encoding these evolving relations. Experimental results demonstrate superior performance and enhanced interpretability over existing methods.
Paper Preview
Abstract
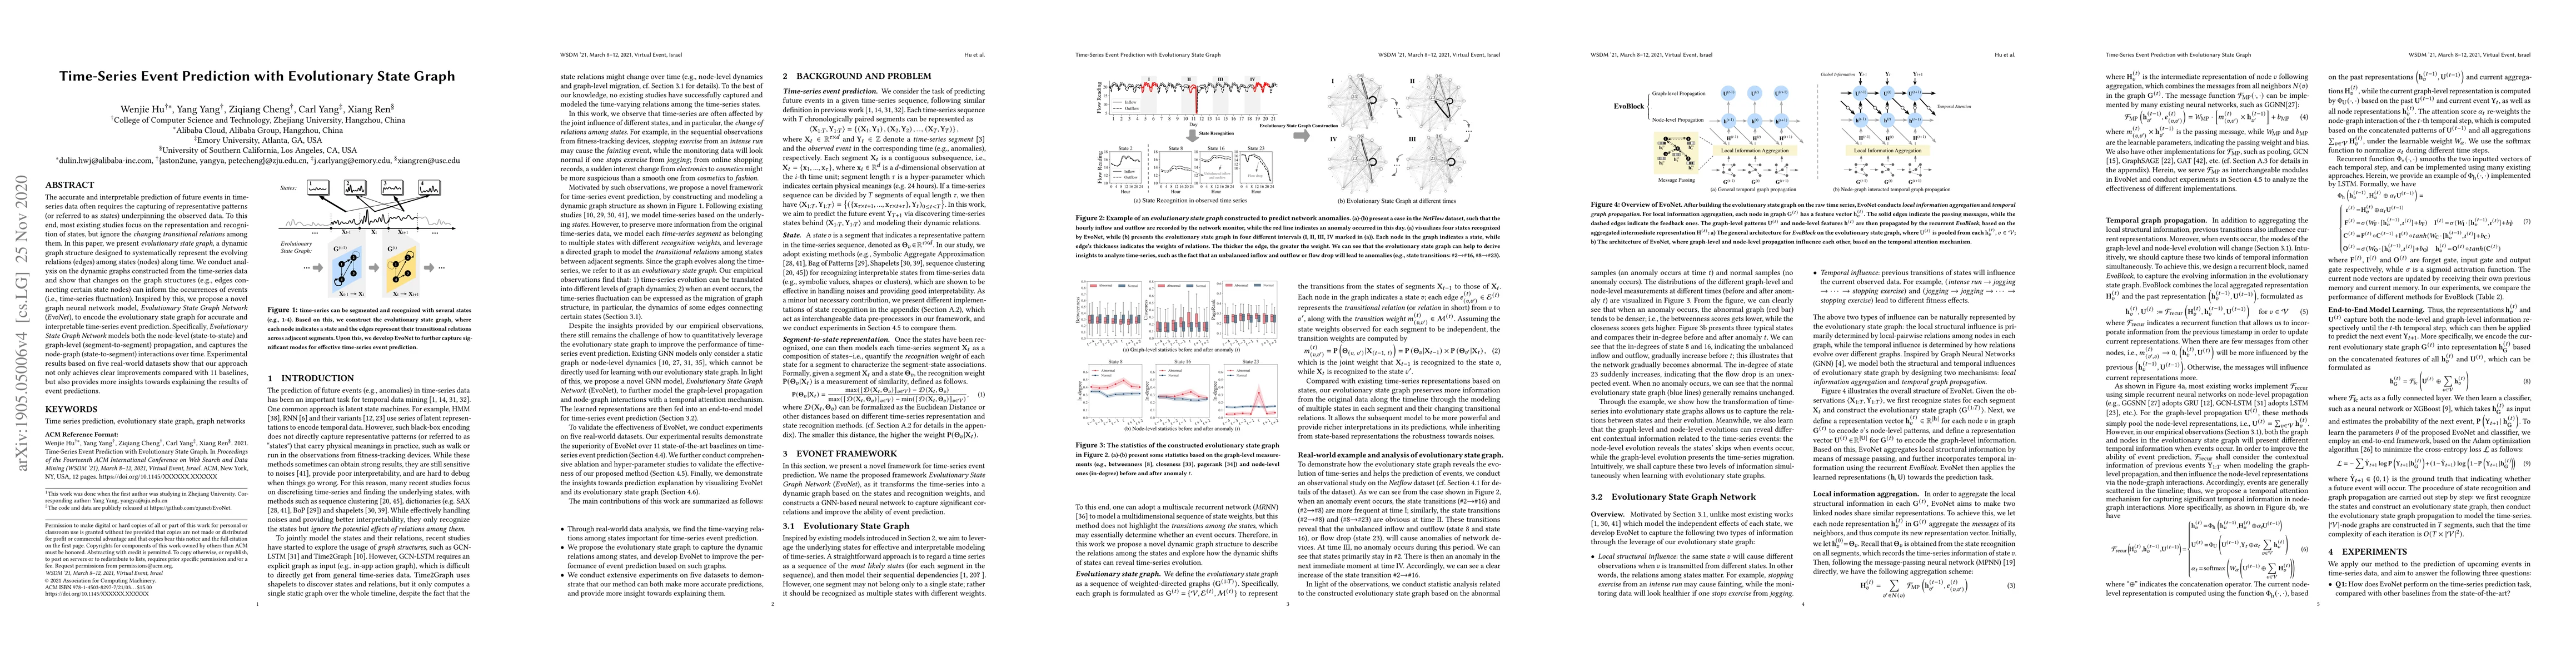
The accurate and interpretable prediction of future events in time-series data often requires the capturing of representative patterns (or referred to as states) underpinning the observed data. To this end, most existing studies focus on the representation and recognition of states, but ignore the changing transitional relations among them. In this paper, we present evolutionary state graph, a dynamic graph structure designed to systematically represent the evolving relations (edges) among states (nodes) along time. We conduct analysis on the dynamic graphs constructed from the time-series data and show that changes on the graph structures (e.g., edges connecting certain state nodes) can inform the occurrences of events (i.e., time-series fluctuation). Inspired by this, we propose a novel graph neural network model, Evolutionary State Graph Network (EvoNet), to encode the evolutionary state graph for accurate and interpretable time-series event prediction. Specifically, Evolutionary State Graph Network models both the node-level (state-to-state) and graph-level (segment-to-segment) propagation, and captures the node-graph (state-to-segment) interactions over time. Experimental results based on five real-world datasets show that our approach not only achieves clear improvements compared with 11 baselines, but also provides more insights towards explaining the results of event predictions.
AI Key Findings
Get AI-generated insights about this paper's methodology, results, significance, and more — seven facets brought into focus.
Impact
Paper Details
Authors
PDF Preview
Key Terms
Citation Network
Current paper (gray), citations (green), references (blue)
Display is limited for performance on very large graphs.
Discussion 0