Publication
Metrics
AI Quick Summary
Summary: TOPCAT is a GUI tool for tabular data analysis, offering advanced visualization options, including a new Corner Plot window that displays linked scatter and histogram plots for exploring large datasets interactively. The Corner Plot visualizes all pairwise and single variable combinations from a given set of coordinates.
Paper Preview
Abstract
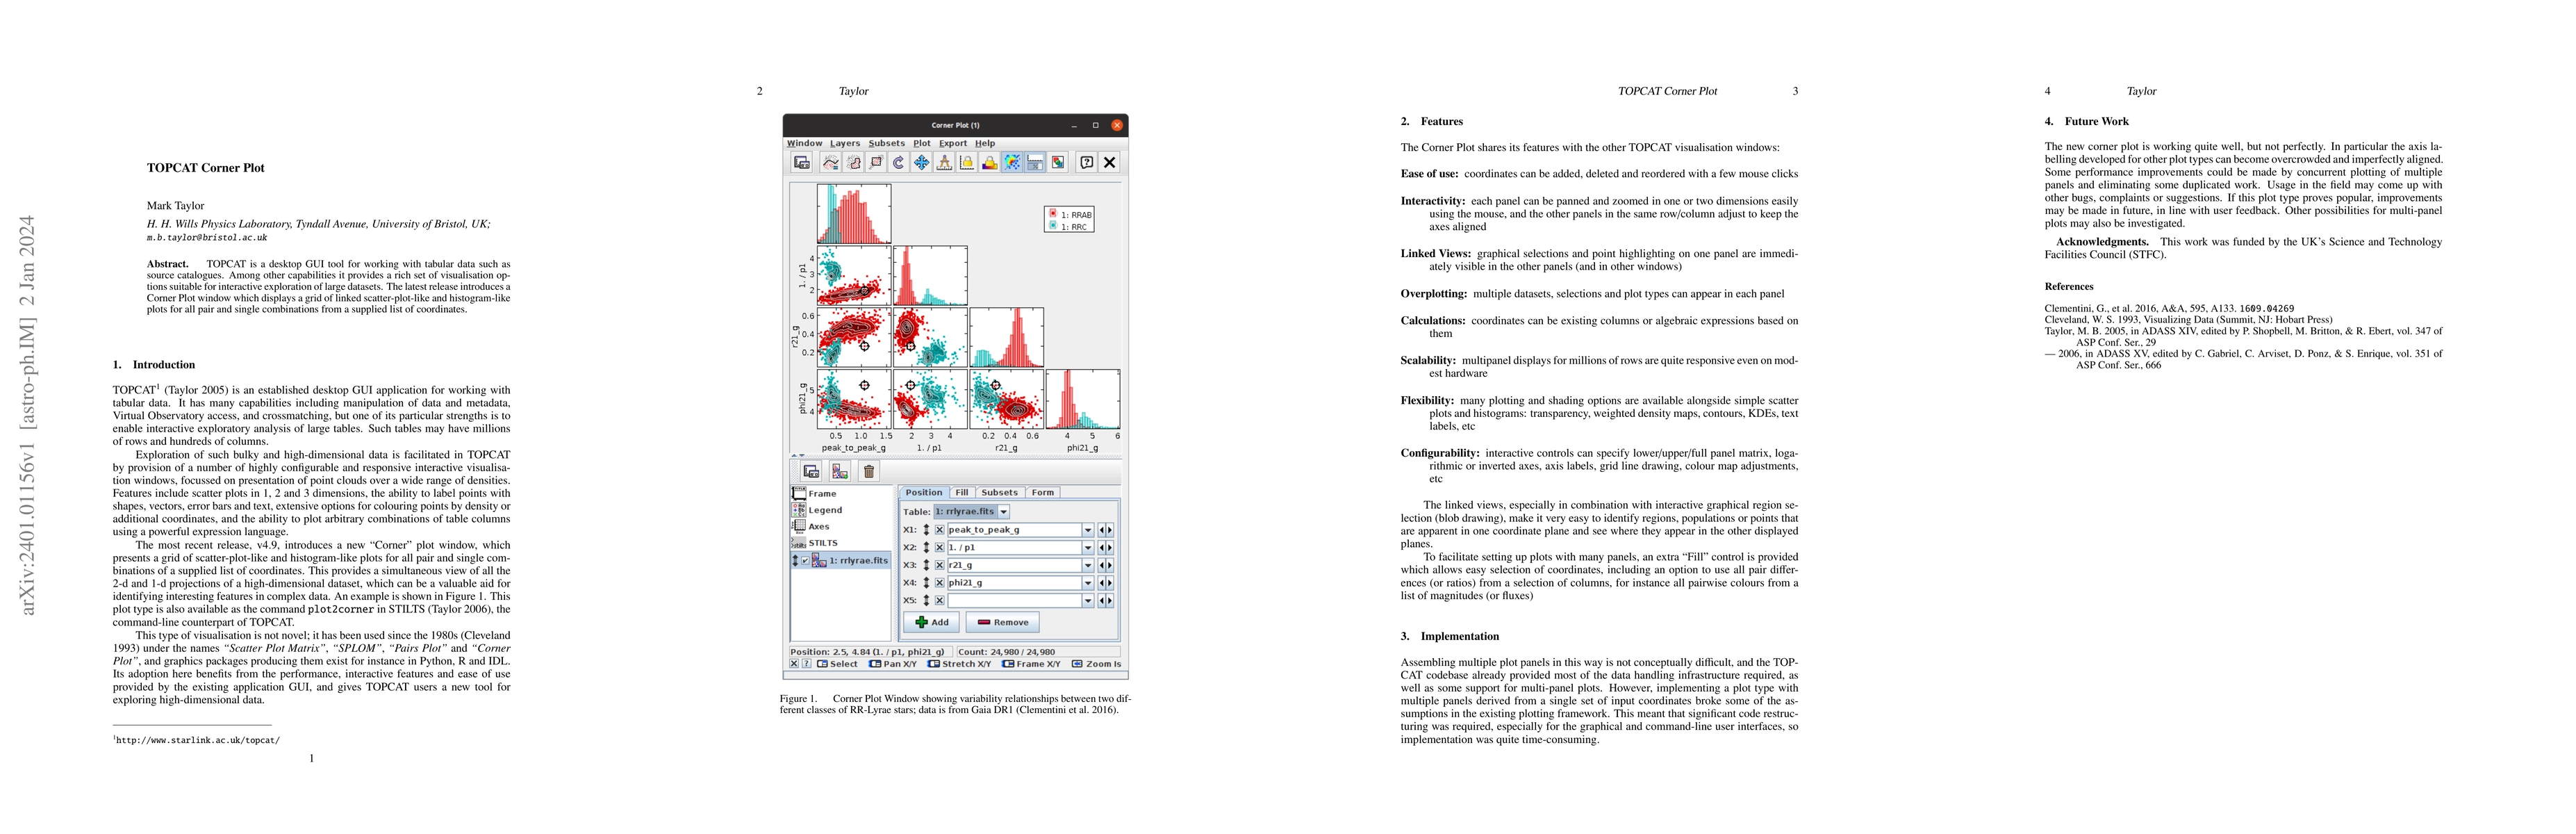
TOPCAT is a desktop GUI tool for working with tabular data such as source catalogues. Among other capabilities it provides a rich set of visualisation options suitable for interactive exploration of large datasets. The latest release introduces a Corner Plot window which displays a grid of linked scatter-plot-like and histogram-like plots for all pair and single combinations from a supplied list of coordinates.
AI Key Findings
Get AI-generated insights about this paper's methodology, results, significance, and more — seven facets brought into focus.
Impact
Paper Details
Authors
PDF Preview
Key Terms
Citation Network
Current paper (gray), citations (green), references (blue)
Display is limited for performance on very large graphs.
Discussion 0